Longest Bull Market in History! (??)
This week, we’re breaking down the longest bull market in history (or IS it?). Usually published on Friday, this had to wait til Monday while Isaiah Jeffrey Tackett was making his entrance into this world at 9lbs 3oz. Maybe there’s more bull left for this lad to enjoy?
This week, without too much pomp and circumstance, the S&P 500 index entered its longest ‘bull run’ in history. At 3,453 days, this marks the longest bull market, beating out the one that ran from October 1990 to March of 2000.
So, what’s that mean? First of all, the S&P 500 is a stock index tracking large US companies. It’s one of hundreds of indices that are used to measure stock market performance, but is probably the most widely used in the industry, even though many people still think of the Dow Jones Industrial Average as the index of record.
Secondly, what exactly constitutes a “Bull Market”? Well, if we’re going to call this the longest bull market in history, we’ll have to stipulate that it refers to the longest time between bear markets. Bear markets, in general, refer to a general downturn in stock prices over a term of longer than a month or two. But this happened in 2015-2016, when the S&P 500 declined 14.2 percent over a 9 month period. So actually, another definition is necessary to make this the ‘longest bull market’ in history. Some economists also require that the market actually be down more than 20 percent over such a period to be a real ‘bear market.’
Actually, the S&P 500 did drop by 20 percent in 2011, if you’re measuring from the high point to the low point during the period from April 29 through October 3. However, the breach of the 20 percent threshold occurred during a trading day. If you only measure CLOSING S&P prices, then the drop during that period was only 19.4%, since the index rose by the end of that last day.
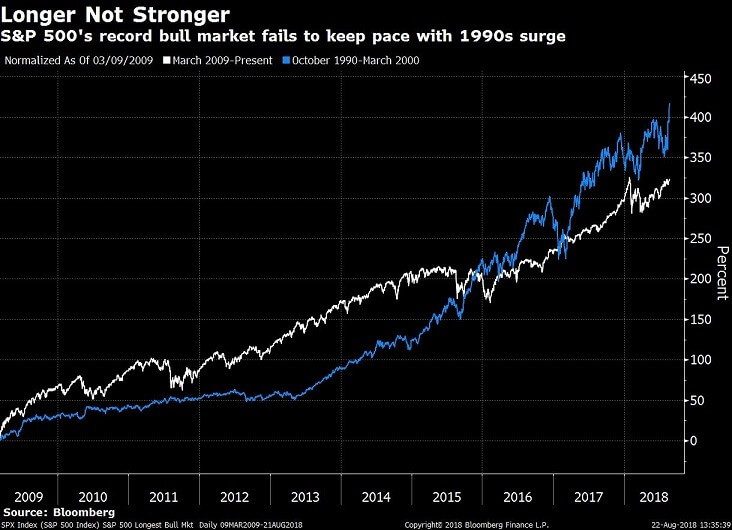
Seems like a lot of data has to be really manipulated to make this the longest bull run in history – but who am I to argue? Bottom line, the 10 years since the huge “global financial crisis” of 2008 has been an opportunity for patient investors to make good money. From its low in March 2009, the S&P is actually up 323%. But even if we stipulate to this being the longest bull market, it is by no means the STRONGEST bull market. The chart below shows that the bull market that ran from October 1990 to March 2000 resulted in an increase of 417 percent.
Bulls (and people) die of old age. So do bull markets die of old age? And if so, shouldn’t we be really concerned about the fact that the market has generally gone UP for so long? Aren’t we getting closer to the next big downturn?
While the last question is always answered with a ‘yes’, the prior two are not by any means foregone conclusions. What really kills a bull market is NOT old age. Bull markets die as a result of corporate profitability going away. What causes that? Higher expenses like borrowing costs as a result of interest rate increases, or costs of goods and services as the result of inflation. Lower revenue and increased expenses are quite simply, the forces that kill bull markets.
As of right now, interest rates ARE increasing – but not terribly quickly. The Fed is raising rates at a very measured pace, and the 30 year treasury, as of the moment of my typing this is actually below 3% (barely – at 2.99%). Inflation is in check, and coming in at close to the Fed’s target of 2%. The real bull-killing forces are not fundamentally changing the overall direction of the market, because they’re not really significant right now.
One other thing: Remember the long bull market that ended in March of 2000? That one ended quite abruptly with the dot-com crash and was also the product of people bidding stock prices up to huge multiples of their earnings. One thing that seems to be absent from this bull market is over-exuberance. Prices are near historical averages relative to earnings and spikes in stock valuations seem to be tempered quickly.
Yes, we’re closer to the next bear market, regardless of how you want to define that term. That said, it doesn’t seem to make much sense at all to look at factors that have no tangible significance (like what a bull market is and how long it’s been running). Interest rates, inflation, and price levels relative to earnings are much more pertinent, and much less amorphous. And those don’t look terribly troubling.