Market Commentary | August 2021
Summary
Market Review
A combination of widespread COVID vaccine availability, a relaxation of pandemic-related constraints, and favorable economic data got the second quarter off to a strong start, with stocks making solid gains in April. The first-quarter gross domestic product accelerated at an annualized rate of 6.4%, claims for unemployment slowed, 266,000 new jobs were added, and manufacturing expanded. Price inflation expanded, although the Federal Reserve asserted that it would continue stimulus measures, even if inflation reached and exceeded the Fed’s 2.0% target. The tech-heavy Nasdaq led the major stock indexes with 5.4%, while the smaller companies of the Russell 2000 turned in only 2.1%. Bond prices increased, pulling yields lower. Crude oil prices ended April at $63.50 per barrel after increasing by more than 7.0% from March. The dollar slipped 2.1%, while gold prices rose 3.5%, closing April at $1,788.20 per troy ounce.
Stocks ended May with mixed returns, with the Global Dow (3.59%) and the Dow (1.93%) posting solid gains, while the Nasdaq fell 1.53%. Sector returns varied, with financials, energy, and materials gaining more than 3.0%, while consumer discretionary and information technology dipped more than 2.5%. Long-term Treasury yields decreased marginally, the dollar dropped 1.3%, while crude oil prices continued to climb, gaining nearly 5.0%. Overall, economic data was positive and confirmed that economic growth was accelerating, but not at the pace some may have anticipated. Labor added 266,000 new jobs, a big ‘miss’, considering the 1,000,000 figure some economists predicted. The number of job openings reached its highest level since 2000, which appears to point to a shortage of available workers rather than a slowdown in labor demand. Inflation was the buzzword throughout the month as consumer prices continued to climb, stoking fears that the Federal Reserve would cut back on stimulus measures in place. The Personal Consumption Expenditures Price Index rose 0.6%, the Consumer Price Index climbed 0.8%, and producer prices increased 0.6%. Nevertheless, Fed officials repeated assurances that the price hikes were temporary due to “transitory supply chain bottlenecks.”
Economic recovery continued in June. Stocks closed the month generally higher, with only the Dow and the Global Dow lagging. Tech shares rebounded from a moderate dip in May to push the Nasdaq to a series of record highs in June. Bond prices rose, dragging yields lower. Yields on 10-year Treasuries declined nearly 10 basis points during the month. Crude oil prices climbed nearly $7.00 per barrel. Information technology led the sectors, advancing nearly 7.0%, while materials, financials, and consumer staples lost value. The dollar rose, while gold prices dropped. June saw 559,000 new jobs added, with notable job gains in leisure and hospitality, health care and social assistance, and manufacturing. Lumber prices fell from record highs and retail vehicle prices may have crested as wholesale auto prices slid. Investor confidence may have been boosted in June with the announcement by President Joe Biden of a bipartisan infrastructure spending package.
Overall, the second quarter was a good one for equities. The Nasdaq gained 9.5%, followed closely by the S&P 500 (8.2%), the Global Dow (4.9%), the Dow (4.6%), and the Russell 2000 (4.1%). Real estate, information technology, energy, and communication services all posted quarterly gains of more than 10.0% to lead the market sectors. Year to date, the Russell 2000 is well ahead of its 2020 year-end closing value, followed by the Global Dow, the S&P 500, the Dow, and the Nasdaq. The yield on 10-year Treasuries fell 30 basis points. Crude oil prices increased $14.17 per barrel, or 24.0%, in the second quarter. The dollar lost nearly 1.0%, while gold prices advanced 3.6%. The national average retail price for regular gasoline was $3.091 per gallon on June 28, up from the May 31 price of $3.027 and 8.4% higher than the March 29 selling price of $2.852.
Economic Review
Employment: We’ve been seeing positive job growth, but numbers are falling short of expectations. There were 559,000 new jobs added in May, below the level predicted by some economists (approximately 650,000). The April figure was revised up from 266,000 to 278,000 — still not quite as robust as had been estimated. In May, the unemployment rate declined 0.3 percentage points to 5.8% while the number of unemployed persons fell by 496,000 to 9.3 million. These measures are down considerably from their recent highs in April 2020 but remain well above their levels prior to the pandemic (3.5% and 5.7 million, respectively, in February 2020). Among the unemployed, the number of persons on temporary layoff declined by 291,000 to 1.8 million. This measure is down considerably from the recent high of 18.0 million in April 2020 but is 1.1 million higher than in February 2020. Claims for unemployment insurance continued to drop. According to the latest weekly totals, as of March 13, there were 3,870,000 workers receiving unemployment insurance benefits, down from the February 20 total of 4,419,000. The insured unemployment rate fell 0.4 percentage points to 2.7%. Claims for unemployment insurance have maintained a steady pace over the past few months. According to the latest weekly totals, as of June 12 there were 3,390,000 workers receiving unemployment insurance benefits, down marginally from the May 15 total of 3,642,000.
FOMC/interest rates: The Federal Open Market Committee met in June. The FOMC offered no significant policy changes following that meeting, maintaining the federal funds target rate range at 0.00%-0.25%, while continuing the current quantitative easing monetary policies. There was a change in the Committee’s quarterly projections, led by a projected increase in the federal funds rate in 2023. The FOMC continued to stress that current inflationary pressures are transitory and are likely to moderate.
GDP/Budget: The economy accelerated at an annual rate of 6.4% in the first quarter of 2021 after advancing 4.3% in the fourth quarter of 2020. Consumer spending increased 11.4% in the first quarter after rising 2.3% in the prior quarter. Nonresidential (business) fixed investment climbed 11.7% following a 13.1% increase in the fourth quarter; residential fixed investment continued to advance, increasing 13.1% in the first quarter after climbing 36.6% in the previous quarter. Exports decreased 2.9% in the first quarter of 2021 after advancing 22.3% in the fourth quarter of 2020, and imports (which are a negative in the calculation of GDP) increased 6.7% in the first quarter (29.8% in the fourth quarter of 2020). Federal nondefense spending climbed 45.0% following a fourth-quarter decline of 8.9% primarily due to added federal stimulus payments and aid. The Treasury budget deficit was $132.0 billion in May, following the April deficit of $225.6 billion. Government receipts were $463.7 billion in May ($439.2 billion in April), while outlays in May totaled $595.7 billion ($664.8 billion in April). The deficit is 67.0% lower than it was in May 2020. The deficit for the first eight months of fiscal year 2021, at $2.064 trillion, is 9.8% higher than the same period in the previous fiscal year. Government receipts rose from $2.019 trillion last fiscal year to $2.607 trillion this year, while government outlays increased from $3.899 trillion to $4.671 trillion.
Inflation/Consumer Spending: Inflationary pressures continued to advance, with consumer prices edging up 0.4% in May after advancing 0.6% in both March and April. Prices have increased 3.9% since May 2020. Excluding food and energy, consumer prices rose 0.5% in May (0.7% in April) and 3.4% since May 2020. Personal income decreased 0.2% in May after falling 13.1% in April. Disposable personal income dropped 2.3% in May following a 14.6% drop in April. These drops largely reflected a decrease in government assistance benefits, as both economic impact payments to households and pandemic unemployment compensation payments to individuals lessened. Consumer spending was essentially unchanged in May from the previous month.
The Consumer Price Index climbed 0.6% in May following a 0.8% increase in April. Over the 12 months ended in May, the CPI rose 5.0% — the largest 12-month increase since a 5.4% increase for the period ended in August 2008. Core prices, excluding food and energy, advanced 0.7% in May and are up 3.8% over the last 12 months. Prices for used cars and trucks continued to rise sharply, increasing 7.3% in May. This increase accounted for about one-third of the overall CPI increase. Food prices increased 0.4% in May, the same increase as in April. Energy prices were unchanged in May.
Housing: Over the past several months, residential sales have slowed. In May, sales of existing homes fell for the fourth consecutive month, declining 0.9% after decreasing 2.7% in April. Nevertheless, over the past 12 months, existing home sales increased 44.6%. The median existing-home price was $350,300 in May ($341,600 in April), up 23.6% from May 2020. Unsold inventory of existing homes represented a 2.5-month supply in May, slightly higher than the 2.4-month supply in April. Sales of existing single-family homes decreased 1.0% in May following a 3.2% drop in April. Year over year, sales of existing single-family homes rose 24.4%. The median existing single-family home price was $356,600 in May, up from $347,400 in April. New single-family home sales declined in May for the second consecutive month. New home sales fell 5.9% in May, the same decrease as in April. Sales of new single-family homes have increased 9.2% from May 2020.
Manufacturing: Industrial production increased 0.8% in May after advancing 0.7% the previous month. Manufacturing output increased 0.9% in May following a 0.4% increase in April. In May, mining increased 1.2% (0.7% in April) and utilities rose 0.2% (2.6% in April). Total industrial production in May was 16.3% higher than its year-earlier level, but it was 1.4% below its pre-pandemic (February 2020) level.
Imports and exports: Both import and export prices rose in May for the sixth consecutive month. Import prices climbed 1.1% following a 0.8% advance in April. Import prices rose 11.3% over the 12 months ended in May, the largest 12-month advance since a 12.7% increase for the 12 months ended in September 2011. Import fuel prices increased 4.0% in May following a 1.6% jump in April. Import fuel prices advanced 109.6% for the year ended in May. Nonfuel import prices climbed 0.9% in May following a 0.7% advance in April.
International markets: While the Federal Reserve continues to preach patience when it comes to rising inflationary pressures, other countries may not be waiting to respond. The Bank of Mexico increased its interbank rate 25 basis points to 4.25%, citing the jump in the U.S. Consumer Price Index. On the other hand, the Bank of England held its monetary policy stance unchanged, with the bank rate at 0.1%. Elsewhere, the Eurozone continued to reopen its economy, but at a slower pace than in the United States primarily due to the slower start of COVID-19 vaccinations. Eurozone manufacturing expanded in June. The Japanese economy has taken longer to recover with their PMI numbers remaining in contraction territory. In the markets for June, the STOXX Europe 600 Index gained about 2.3%; the United Kingdom’s FTSE rose 1.1%; Japan’s Nikkei 225 index fell 0.2%; and China’s Shanghai Composite Index declined nearly 1.2%.
Consumer confidence: Consumer confidence improved in June, with The Consumer Confidence Index® advancing 7.3 percentage points to 127.3. According to the report, following June’s increase, consumer confidence is at its highest level since the onset of the pandemic in March 2020. Despite consumers’ expectations that short-term inflation will increase, this had little impact on consumers’ confidence or purchasing intentions.
Looking Forward
All Eyes on Inflation
Early indications bear out the notion that prices are spiking. Core CPI has jumped to a level higher than we’ve seen in over a decade.
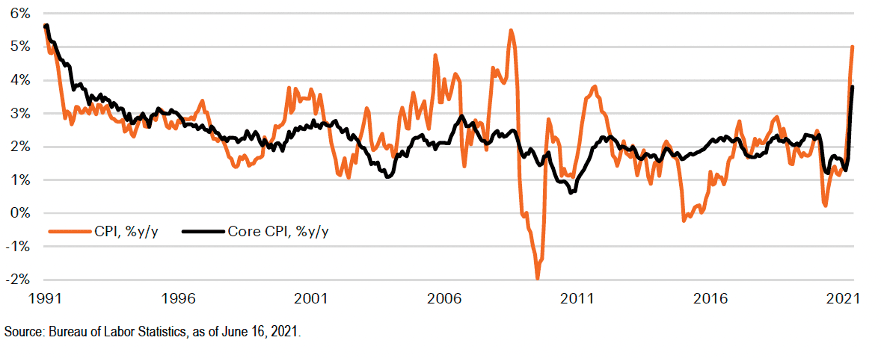
A substantial stockpile of stimulus dollars is starting to chase newly re-opened economic opportunities. Meanwhile, supply-chain disruptions have impacted the supply of some goods and services. All of this comes at a time when year-over-year statistics look much more dramatic, coming off significant price declines from a year prior.
Transitory or Sustained?
The primary question is: are these inflationary pressures here to stay, or are we seeing a temporary spike? There are plenty of analysts taking both sides of that argument. The argument for inflation being temporary largely derives from two assumptions: The first is that transient factors are driving inflation now. Of the 5% headline CPI increase in May, more than half of that was driven by costs in new cars, hotel rooms and transportation, areas where price increases are largely seen as short-term. These products and services make up only about 3% of the US economy.
Wage inflation is seen as a larger factor in driving longer-term, more systemic price increases. While there are indications that wages are under upward pressure, some of that could be the result of distortions created by the fact that layoffs happened much more quickly than the re-hiring of workers is happening. Overall, wages aren’t spiking with other inflation components.
Markets seem to be pricing a scenario where inflation exceeds the Fed’s target of 2% slightly for several years. This is also the base case of the Jerome Powell’s FOMC. Any trend higher in these expectations my rattle markets in the 3rd quarter.
Some allowance for letting inflation run a bit ‘hot’ during a recovery is to be expected. The primary risk to an arguably expensive market is that growth falls short of projections while inflation continues to run hot. We see the probability of this ‘stagflation’ scenario as relatively low, but it can’t be dismissed out-of-hand as a risk to watch for.
Bubble or Secular Bull?
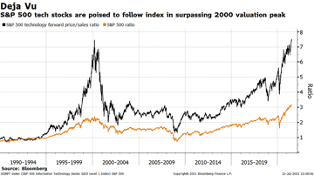
The run-up in prices of large technology companies is one area where concern is on the rise that prices may have moved to far, too fast. This could be especially concerning given the unprecedented amount of leverage in the market. A downturn could be magnified if traders need to quickly unwind financed positions.
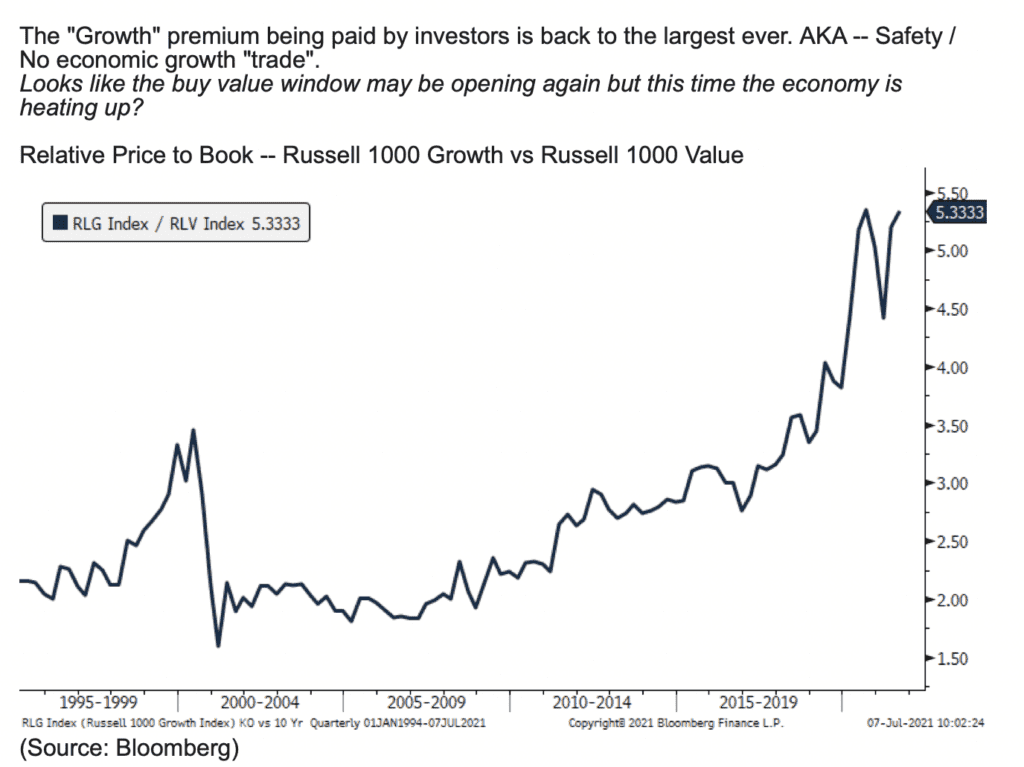
Disparities between higher-priced ‘growth’ stocks and those whose prices are lower relative to earnings have expanded to near-record levels, leaving many to believe that ‘value investing’ may yield greater opportunities in the foreseeable future.
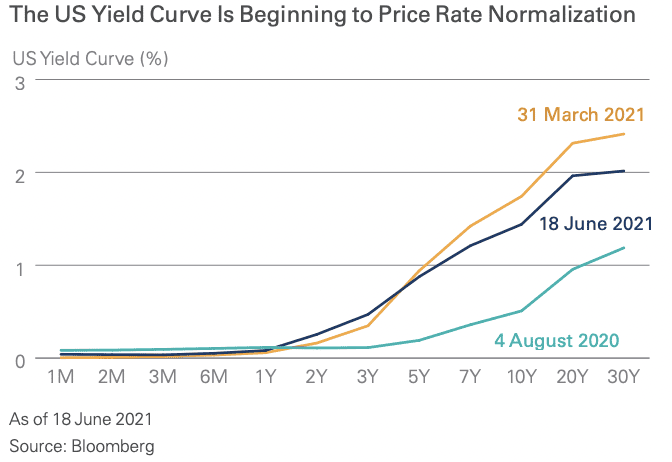
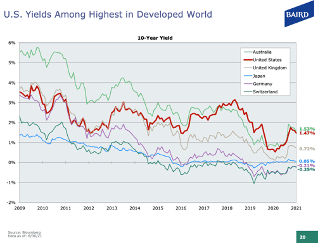
Meanwhile, the yield curve, while slightly ‘flatter’ than it was last quarter, continues to hint at upcoming normalization in rates. US yields, while low by historical standards, are still competitive with many other western economies.
Opportunities abroad
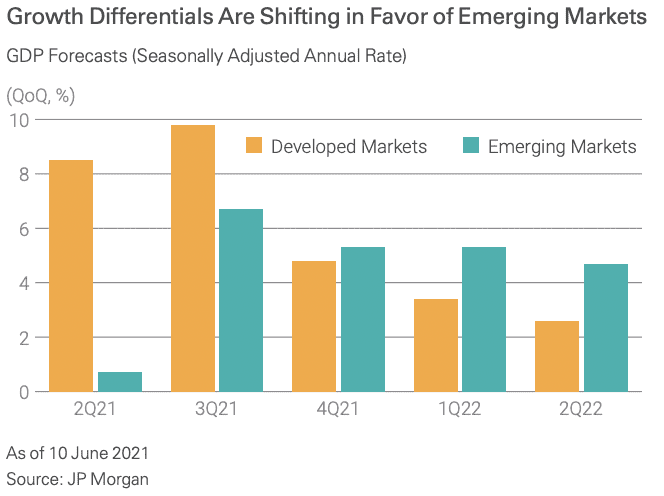
Emerging markets have been rebounding at a slower rate than developed markets. That dynamic, however, is expected to shift significantly over the upcoming year. As the global economic recovery from the COVID pandemic continues, and US markets continue to reach lofty valuations, some of the best opportunities in the shorter term may exist overseas.
Overall, we think that slow, steady recovery will continue to drive economic activity in the 3rd quarter. Given market valuations and the possibility of more headline risk on the inflation front, we feel that a defensive posture is warranted. Still, with long-term inflation expectations muted, along with GDP growth projections above trend, the progress the markets have made to this point may be justified and any volatility that plays out in the short term may not derail what we see as a continued expansion. A keen focus on fundamentals seems warranted, along with some caution around areas in the markets that have seemingly been driven to extreme valuations.
DISCLAIMER: The foregoing content reflects the opinions of Penobscot Financial Advisors and is subject to change at any time without notice. Content provided herein is for informational purposes only and should not be used or construed as investment advice or a recommendation regarding the purchase or sale of any security. There is no guarantee that the statements, opinions or forecasts provided herein will prove to be correct.
Transcription
Sam Chapin:
All right. Hello every body. Welcome to the newest edition of the PFA Quarterly Commentary Update. It is just about beginning of August now, August 4th, but we are recapping quarter number two, and giving a little outlook on what we’re going to be watching into the future. As always I’m joined by James Bradley.
James Bradley:
As always, I’m glad to be with you, Sam.
Sam Chapin:
Yeah, glad to have you here. So we’re going to try to keep this short for you, jump right into it. Same format, start off with the economic review. You’re going to see us talking a lot about inflation, that is the hot topic that everybody’s talking about. Obviously, coming out of a pandemic and a bit of a crisis, money supply has been increased dramatically.
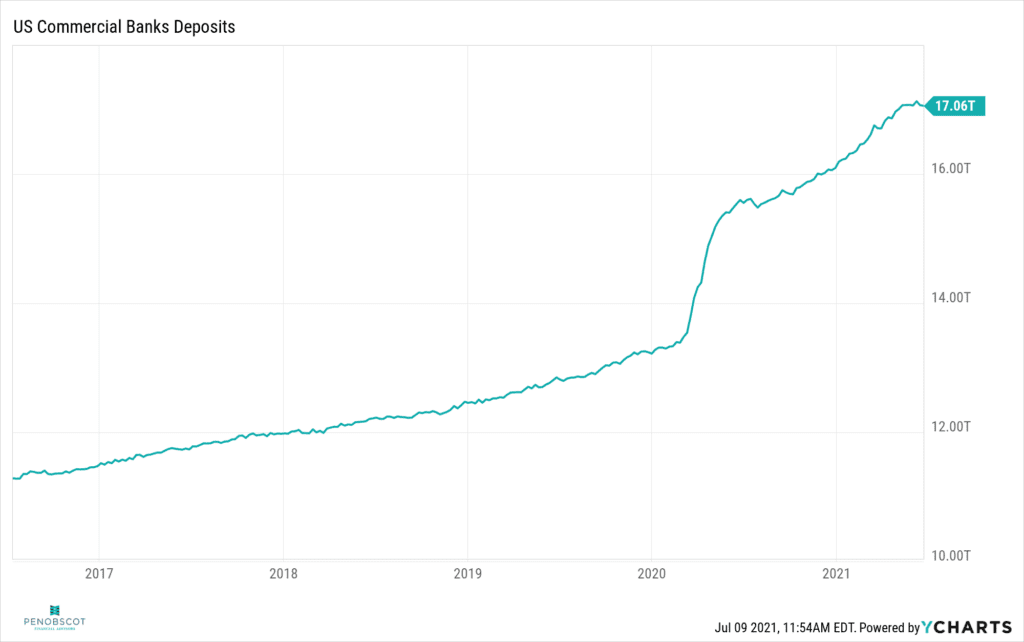
This first slide is going to look at commercial bank deposits, which shows that there’s a lot of money sitting on the sidelines, more than any time in the past and that is increasing the risk of inflation. A lot of conversation about whether this inflation that we’ve seen in recent months is going to be sustained, or transitory?
Maybe some people call it structural or transitory. Is it going to go away over time as the baseline catches up? Right now, we’re comparing prices to a year ago where prices were a little bit suppressed at that point, since demand was down in a big way. But as we move forward, are we going to see things level out a little bit? That’s the big conversation that people have very strong opinions on. We find people very strongly on one side or the other, not a lot of people in the middle, but we’re going to give you a couple of reasons it could be sustained, a couple of reasons it could be transitory.
This commercial bank deposits is an area where it can be a little scary and could be sustained if all this money starts getting deployed into the economy, and pushes up a lot of demand, a lot of upward pressure on prices from that extra money chasing the same amount of goods.
So that’s one reason that there could be some sustained inflation if people do go out wholesale and start spending all their money. Let me kick it over to JB for the second slide.
James Bradley:
Sure. That’s commercial bank deposits, if we look at another kind of way, similar types of information that we can get out of just looking at general household wealth, not just including what’s sitting in the bank, but what’s overall, a part of the assets that could be chasing, again, like you say, limited goods and services in the economy.
Certainly a big spike, a year over year change of almost 25,000,000,000… I want to say billion, that’s a big number, $25,000,000,000,000, that’s a lot of zeros. That’s the largest percentage that we see there, is also held by people in the age 55 and up category, my homeys.
And these are the people that are more inclined to probably chase some of the service types of parts of the economy that are certainly under a little bit of price pressure right now. And so that could go either way, I suppose. Some of these areas as they kind of fill out and things get back to normal, could see their prices get back down into kind of normal trends.
So that could be another part of the argument for transitory, but also, just general wealth increases overall, especially a spike over a short amount of time. [crosstalk 00:03:35].
Sam Chapin:
Yeah. It seems like it should be a good chart, right? Everybody’s wealth is going up…
James Bradley:
Right.
Sam Chapin:
But if everybody’s wealth goes up and then nobody’s wealth really goes up, because the prices will rise to match that. We did a whole podcast on inflation recently, if you guys want to check that out, but an interesting concept there about why maybe we haven’t seen as much inflation after the financial crisis, was that changing demographics in the US and as older people accumulate more wealth, they’re a little more prone to save it than they are to spend it, especially as they’re approaching retirement age. So that leads to those higher bank deposits that we just mentioned.
James Bradley:
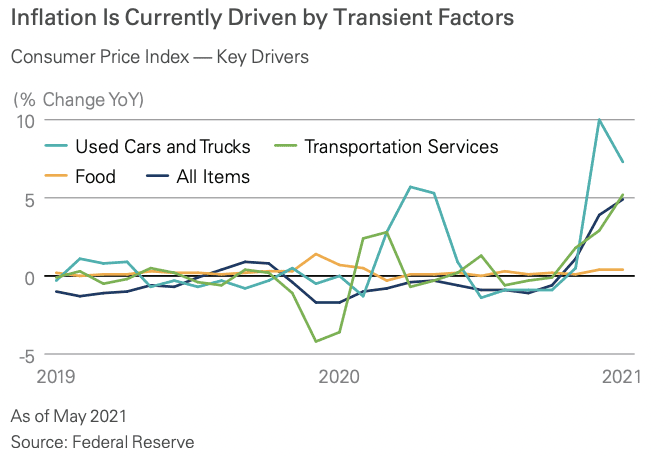
Sure. And if we look at areas that are driving inflation right now, the price increases that we see right now that are making headlines, where are those? Those are happening in things like used cars and trucks, transportation services, a lot of supply chain issues that are going on there.
Those are, by pretty much anybody’s definition, issues that are probably transitory. And you look at something like food, which doesn’t tend to increase or decrease as far as the way people consume it, based upon the economy. And that’s staying a little bit more in the middle.
So one and a half percent of year-over-year CPI increase is the result of just used car prices alone, which is a huge part of that. And again, likely transitory, 1% is attributed to baseline effects. So even the inflation that we’re seeing right now, there’s a lot of good hope anyway, I guess, that what we’re seeing is healthy and likely not all that very long-term.
Sam Chapin:
Yeah. It’s a kind of an anomaly there with the used cars. I saw that the used cars have only about a 3% weighting in the CPI, but the prices are up about 45%.
James Bradley:
Wow.
Sam Chapin:
[crosstalk 00:05:28] So that’s what leads to that 1.5. So you pull that out of the, about 5% CPI print we get recently, brings you down about 3.5, is another about percent that they’re attributing to the baseline effects of the fact that prices were depressed a year ago, and we’re comparing to those prices.
James Bradley:
Sure.
Sam Chapin:
So there is a silver lining there, if you dig into the numbers a little deeper. Another silver lining here supporting the transitory argument is that production remains pretty low, as Fed Chairman Powell said, this has kind of been the perfect storm of you’re increasing demand with all the stimulus we’ve done at the same time. Supply chains are under a lot of pressure, so demand going up, supply going down, raises prices.
So that’s one indication here, is that production remains below its long-term averages. There’s still a lot of room for the supply side to ramp up and increase a lot more goods and services out there. And as they do that and supply chains normalize, we should see some normalization in prices as well.
James Bradley:
What you’re saying there, it looks like when you look at the supply demand curve, demand is obviously boosted up a lot, but there’s hope supply can maybe keep up.
Sam Chapin:
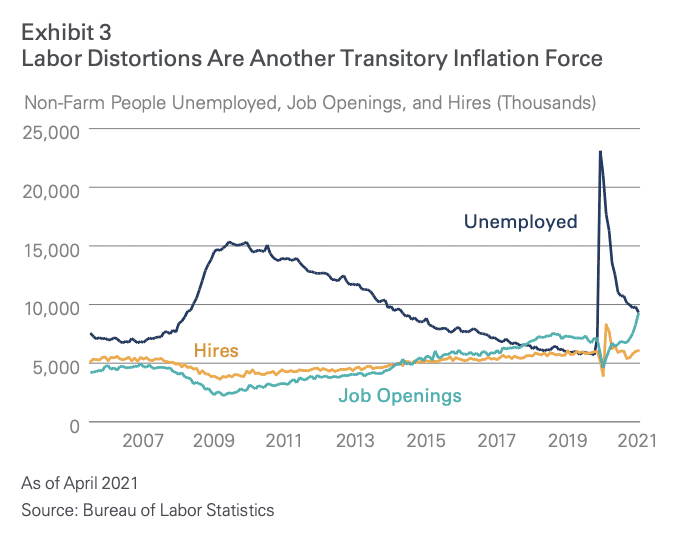
Next slide. Another area here is labor distortions. We’ve seen that huge spike in unemployment. Recently, employment rate around 5.9%. We did get a disappointing jobs number out today, but overall, a lot of the jobs that we lost, about 16,000,000 jobs, I think we’ve gained about 13,000,000 of them back.
So it’s a fairly substantial recovery there so far, but you can see the job openings number is now matched, the unemployed persons… unemployed people’s number. So there are enough jobs out there for everybody, but it gets a little hairy if a lot of people are not rejoining the labor force as quickly as a lot of economists would have liked to see.
And what happens there is jobs have to start kind of bidding to get people back into the labor force by raising their salaries. We’ve been seeing a lot of that across every sector, from fast food restaurants to banking sectors, where prices or salaries rather are coming up to entice people to come back.
What you got to worry about there is something called a wage price spiral, which is that… It sounds complicated, but pretty intuitive actually, that if you start getting paid more, you’re spending more money. You’re spending more money, that increases the prices because the pushup on demand, and then you require more money again. So go ask for a raise, you spend that money, prices go up. You ask for a raise again, and that’s something to be watchful of.
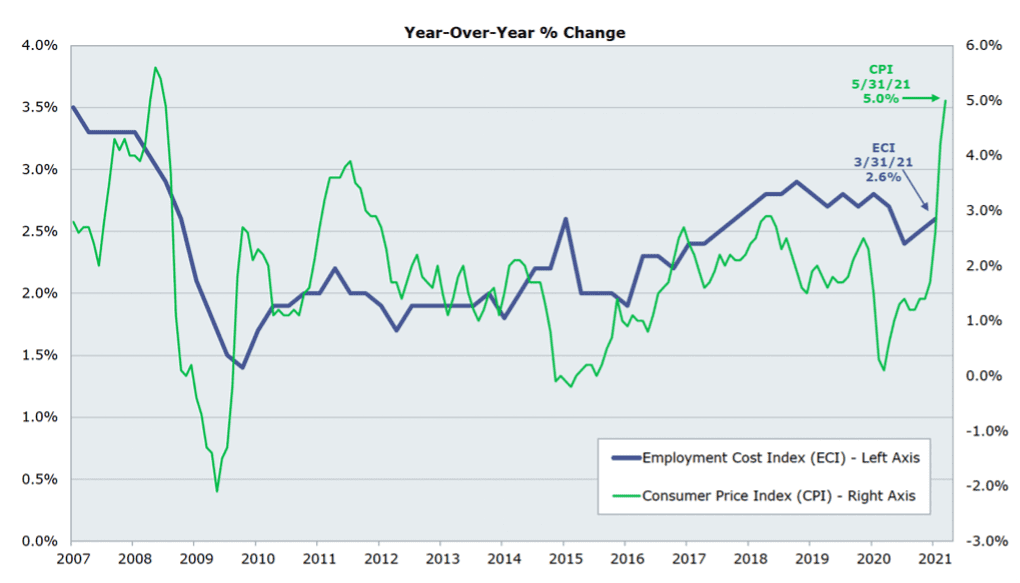
So a lot of people keeping a close eye on this wages and salaries here in the US, which you can see has gotten back in line with its long-term trend, which is not a problem. But if you start to see some substantial increases there, that’s a sign of more structural inflation that could be a problem.
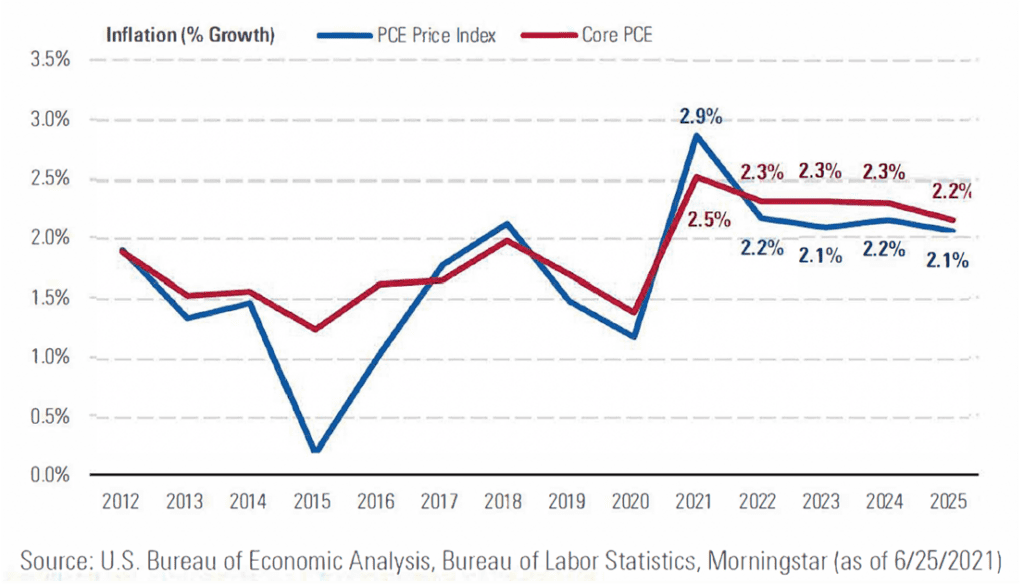
On this final slide here of the economic review, this is the forecast for the PCE, which is the preferred metric for the Federal Reserve measuring inflation. And right now, you can see they typically target around a 2% inflation rate. Recently they’ve said they’re going to let that run hot a little bit, but the forecasts here are not so concerning.
You’re seeing a quick spike up here in 2021, and leveling out after that. Devil’s advocate, these are coming from the Bureau of Labor Statistics, and closely aligned with what the Fed is saying. The devil’s advocate would say the Fed is not going to come out and say that inflation is going to run away, right?
James Bradley:
Right.
Sam Chapin:
If they did say that, then it certainly would because [crosstalk 00:09:01] Everybody would go out and start spending their money before the purchasing power erodes. So grain of salt there always, but that’s what we’re looking at for the forecast for inflation at the moment, not too concerning as the policymakers are saying, a lot of people saying it’s going to be transitory.
I talk with a lot of fund providers, JP Morgan, Goldman Sachs, a lot of people out there and ask this question, it’s always the first thing that they want to talk about. And I found that everybody that sells a commodity fund wants to say that inflation is going to be very structural, or the people that aren’t are saying it’s not going to be. So you always got to be…
James Bradley:
Considering the sources.
Sam Chapin:
Exactly. Right, can hop into the market review. I’ll kick this one off.
James Bradley:
Sure.
Sam Chapin:
Equity valuations here is the chart we’d like to take a look at, pretty much every quarter. And it’s showing in the chart, the line chart is the forward PE. You’re seeing a pretty high level there, 21.53 PE ratio versus a 25-year average of 16.71 is straightforward.
This is a pretty high valuation level, and this is on a forward basis too. So it’s not like we’re comparing trailing earnings to prices which were depressed from the pandemic. We’re looking at prices per share, divided by the forecasted earnings per share, and it’s looking pretty high. So the only way this comes back down is if either prices come down or if the forecast of earnings go up.
These things tend to [inaudible 00:10:24] to the mean over time. There’s a lot of other valuation metrics in the table there that also generally say that the valuations are looking pretty steep at the moment. I’m the only one that’s saying it’s not, is the earnings yield spread, which is an interesting one too, because that’s looking at the reciprocal of the price earnings ratio.
So if you took earnings per share and divided it by price per share, that’s your yield, at about 1.28% right now. And you compare that against the fixed income corporate bond market, where an average corporate bond BAA is getting 0.09% yield on interest. So that supports stock prices, does not just by the fact that there’s not really an attractive alternative to goat towards.
So if we do see interest rates start coming up, you can be sure there’ll be a little bit of a flight from stocks over interest, over to fixed income as it becomes a little more appetizing.
James Bradley:
I guess the CliffNotes version to this slide is stocks are expensive relative to historical norms, but not expensive relative to where else can you put your money in the market.
Sam Chapin:
That’s a good way to put it. Absolutely. So again, there is a little bit of a silver lining here in that those are the average PEs, but there is a wide dispersion among stock valuations at the moment. Here, we’re looking at the median PE, so the one in the middle of the S&P 500. In the middle we’re trading at about 19.8 right now, versus the 15.9 on the long run average.
So little bit overvalued from that standpoint, but if you see that dark gray shaded area, that’s showing that this valuation spreads, and you can see that really skewed to the upside right now, which means about half the stocks there on the upside have really high valuations. But there’s still a decent amount under that median, or there’s some value opportunities that becomes an opportunity for stock pickers to be careful and not be chasing those medians that are up very high.
I think we’ve mentioned in the past, the S&P 500 is weighted by market cap. So things like the Googles and Apples that have PE ratios up in the 28, 30 range have an outsize effect on the overall average, however that they don’t make up the entire stock market.
James Bradley:
Right.
Sam Chapin:
So that’s something to be aware of.
James Bradley:
Okay, growth versus value, and this is another kind of a takeoff on what you were just saying there, Sam. The big gains that we’ve seen pretty much since the beginning of the pandemic, and frankly, over the past 10, 15 years have largely been on the growth side of things.
And we talk about growth, we’re talking about stocks that typically do trade at those higher price to earnings multiples, because they think those earnings are going to be going up over time, relative to a stock that might not trade at such a high multiple, but gives off reliable earnings and potentially dividends on a regular basis.
So the former, the go-go things are considered growth. The latter, the things that are a little bit more steady Eddie are considered value. And there’re ways that we can kind of differentiate between the two, but what we need to really pay close attention to here, and this has been coming on for some time, as you can see. This graph goes back all the way to the early 1990s, early mid-1990s, is that there’s been a pretty steady progression of growth outperforming or, outgrowing, I guess, value stocks.
And we’re to a point right now, where the premium essentially, that’s being paid to investors is at the largest point ever. And it was at the largest point ever before we went into this recent correction, but it’s back up there again. And so often value outperforms in recessionary periods. This is one of those periods where we’re saying there’s a time for value to outperform.
We’re not looking at a recessionary period. We’re looking at a period where the economy is heating up. So we’re seeing something that’s really giving us a sense of value should outperform, but we’re in definitely uncharted waters when it comes to how do we expect value to outperform as long as the economy is still heating up?
So it’ll be interesting to see how this plays out, but it’s hard to argue with the idea that growth has maybe had its time relative to value, and that value may have a little bit more cheerful prospects in the foreseeable future.
So jumping off of stocks for a little while, and just looking at my favorite area, the bond markets, the only thing that… The bond markets are, again, just like we’re seeing with growth versus value, we’re looking at uncharted territory.
Looking at uncharted territory on the bond markets too. We’re looking back beyond the end of the second quarter, over the month of July, the 10-year Treasury actually dropped 25 basis points from about one and a half to one and a quarter in its yield. In other words, people are piling their money into bonds at the same time as you wouldn’t expect them to necessarily be doing so, because of the fact that the equity markets are doing well.
So what we’ve seen since August 2020, is definitely a curve that’s trending more toward normalizations, steepening up a little bit, giving people more return for longer time deposits in guaranteed government debt. But as you can see, the blue line has dropped off a bit from the gold line. The June line has dropped off from the March line on the far end, and it’s continued to do so.
So we’ve been seeing a little bit of a curve flattening. Curve flattenings tends to kind of indicate a market that’s looking for a slowdown in growth and/or a recession. It gets so flat that the long-term end goes lower than the short-term end. We certainly don’t see that currently. We certainly don’t see that as a probability in the near term, but it’s interesting to watch and to try to figure out why that’s the case?
For some reason or another, the bond market and people in the bond market are still not needing to be rewarded substantially for locking up their money for a long-term period of time.
Sam Chapin:
Yep, that is the case. So a few things we’ll be watching looking forward, Jim, you want to talk a little bit about economic growth estimates?
James Bradley:
Sure. So the bond market’s telling us one thing, everybody else is telling us other things, and it’s one of those kind of interesting times to be in the business. And it’s not surprising, anytime you get this kind of a substantial shock to the economic system, and this kind of a huge response to that shock that we’ve seen fiscally, domestically, and across the globe, you’re going to see things that don’t necessarily line up with their historical norms, I think, in a lot of ways, while we work these things out.
One thing that’s been interesting to see is kind of adjustments to how are we going to grow out of this? And almost universally, the answer is pretty rapidly. The Morningstar is showing us an estimate of about 6% US GDP growth on their June report. And that’s down a little bit from where they were estimating it to be back in April, but significantly up from where they were estimating it to be before the vaccination stats started to roll out really well when they came out with these in February.
So a little bit of a retracement of their exuberance, I guess you could say, as to where we’d be in 2021, but look ahead in the next couple of years, they’re also predicting relatively significantly higher growth than originally forecast in 2022 and 2023.
So certainly, there’s some hope there, and I think what we’re seeing more than anything else is economists starting to say, “Yes, we’re going to get this relatively go-go growth that we were originally planning,” but because of things like… You name it, Delta variant, what have you, that may take a little bit longer and be a little bit longer in the tail to manifest itself.
So it’ll be interesting to watch, but certainly by 2024, 2025, we go back toward trend. The interesting thing here is that after all is said and done, it looks like we leave with a trend line that’s not all that very different from where it would have been before the pandemic. So the overall effects of the pandemic may go away completely after time.
Shifting growth prospects is the slide that we see here. And right now, most of that growth, as we come out of this, is coming from developed markets. But JP Morgan and their release here from June has been pretty clear about them thinking that, that is going to switch places a little bit, and that developed markets are going to continue to grow but at a slower, seasonally adjusted rate, relative to emerging markets, which are going to start to take over potentially as early as the fourth quarter of this year.
Sam Chapin:
Yeah. Developed markets definitely had a lot more power to buy themselves out of the pandemic, the stimulus monetary and fiscal policy, where emerging markets, not so much, but returning to emerging markets, having higher growth is kind of the typical state of affairs that we want to get back to.
James Bradley:
Right.
Sam Chapin:
Moving over to a pandemic that is not over. I don’t think anybody wants to keep hearing about the pandemic, but unfortunately it is still here with us. And we’re seeing what looks like a fifth wave due to the Delta variant. As Jerome Powell said, each wave of the pandemic has had less economic impact as we’ve become more resilient to it. It’s not like all the businesses need to reinvent the wheel all over again. They’ve been through it a few times before.
However, it will still have an economic impact. This is just showing that cases ticking up here. On the next slide, we’re looking at the vaccination rates, new estimates about herd immunity. They used to say 65%, 70% to get to herd immunity. Now with the Delta variant out, we’re hearing numbers closer to 80%, 85% vaccination rate in order to meet… Sorry, reach herd immunity.
Unfortunate, a little daunting that we’re only at about 50% right now. So there’s still a lot of room to make up, to reach herd immunity there.
James Bradley:
I did hear recently, some encouraging news out of places like Louisiana, where there’s only over the past few weeks, partially as a result of the Delta variant, partially as a result of maybe people seeing more and more evidence that the vaccines work, that there’s been about a 40% pickup in vaccination rates in some of those areas.
Sam Chapin:
Oh, good.
James Bradley:
So that’s a good thing.
Sam Chapin:
Yeah, a lot of places are getting inventive with the lotteries and such too, which is good to see whenever you’re going to do.
James Bradley:
Right. Oh, I’m going to jump on this one. Yeah, as we look at markets that are certainly showing price levels relative to earnings that are higher than normal. As we’re looking at the potential for there being some froth, we’ll call it, in equity market valuations and that type of thing.
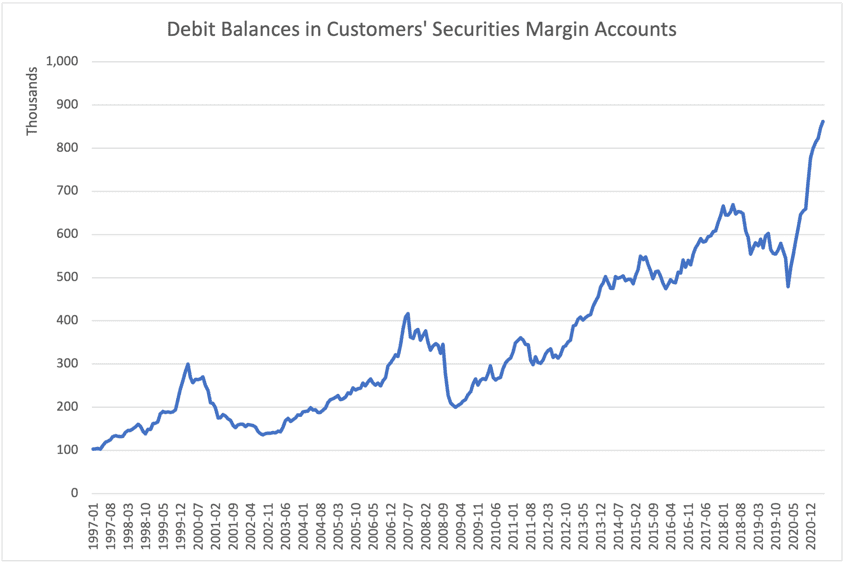
And at the same time, as we’re looking at a pandemic that’s clearly not over, and that we’ve got some room to go. One of the things that starts to catch my attention anyway, is the amount of leverage that people are using in their accounts. And this graph that I was able to create from data from FINRA, shows just overall debit balances and customer security margin accounts.
In other words, when they’re buying stocks and bonds in their portfolio, how much of it are they actually borrowing money to buy? And as you can see, there’s been a pretty sizable jump upward, and this is what? Over the past less than a year, really, that we’ve seen such a pretty significant spike upward in debit balances.
Where that creates potential concern is that if the Delta variant slows things down relative to where we thought we’re going, or if people realize, “Gosh, stocks are priced at a level that they’re not all that very comfortable with,” and we do have some kind of a correction or a market downturn, which we frankly, haven’t seen a substantial one in now over a year. Are we going to see that get exacerbated by people having to unwind positions due to margin calls? And that type of thing.
So whenever we see this kind of a spike upward, it’s not in and of itself, something that is a bad indicator, so much as it’s something that says, if everything else kind of ganged up and we did have a bit of a pullback, that pullback could be a little bit more sharp than otherwise, it would be if people weren’t as leveraged up in their accounts.
Sam Chapin:
Agreed, there’s been a split where during the pandemic, consumers have actually improved their balance sheets. And we saw those high bank balances and paying down a lot of debt and whatnot, but on the investment side and the corporate side, money’s cheap. And when money’s cheap, people tend to lever up.
James Bradley:
So true. We’re seeing a market right now, as of the data for us recording this, volatility in the market is not very substantial. There are things out there that lead us to think that we could see volatility pick up. And if, and when we do that, I always like to kind of go back to this slide.
JP Morgan’s been including it in their guide to the markets for many years now. And it just kind of keep it up to date year to year. It shows you where the S&P 500 and each year, as far as a percentage increase or decrease, but also on that same chart, the dot plot for how far of a top-to-bottom fall happened at any given point during that particular year.
So on average, it’s important to point out that we see entry year drops of 14.3%. We’ve seen nothing close to that so far this year. The biggest drawdown we saw was 4%. Despite that, though, it’s important to keep in mind, the annual returns are positive 31 and 41 years.
We’re going to tell you the same thing as I hope just about anybody in the market tells you, which is that we don’t know if and when the next big downward spike is going to come, but this is the graph that you need to kind of go back to and look at and say, “They do happen.” They happen relatively frequently, historically, these downturns, and they’re good things to ride out because overall, over that period of time that they’ve measured the market from 1980 through 2020, so far in 2021, we’re looking at an annual average rate of return of 9% on the market. It’s still worthy of hanging out through those downsides.
Sam Chapin:
Yeah. Reminds me of a study Fidelity did a couple of years ago. It’s just a great anecdote to explain this, is that they were looking into some of their highest returning accounts and trying to identify what characteristics these people had in common, and what might lead to being a person who has outsized returns?
And the only two characteristics they were able to come up with was people who were dead or locked out of their accounts. So it just kind of goes to show that sticking to your guns, staying in the market is the way to go. I think as financial advisors, it’s some of the best value we can provide you, is not letting people succumb to the behavioral biases we all have of wanting to panic sell and FOMO buy, and it just generally doesn’t work out.
So even though you will see these, some drawdowns like this over the long-term, you’re going to be just fine.
James Bradley:
An old kind of mentor of mine always put it, “We’re not going to keep you off the roller coaster. We’re just going to make sure you don’t jump out of the car.”
Sam Chapin:
A couple of quick, last slides here, just about shifting employment prospects. Obviously, we’re not going to come back to the same normal we had before the pandemic. The job market will come back, but it might shift a bit. And it’s just showing some of the jobs that might have the highest growth prospects.
No surprise there, with epidemiologists and medical scientists. Web developers also makes a lot of sense. But then on the other side, on the downside, we’re looking at hosts and hostesses, bartenders, reservations, a lot of kind of leisure and customer service positions that could be in for a little bit of a diminishing prospect going forward.
James Bradley:
Not many big surprises there, and I think this says a lot to that graph that we saw earlier, where we’ve got 8,000,000 job openings and 8,000,000 jobless right now. And I think that in a lot of cases, some of these job openings are in that earlier slide, and some of the job lists are on this slide. Unfortunately, it’s going to take a little time to sort that out.
Sam Chapin:
Yep. Great. Well, that’s all we have for you today. Thanks for joining us and we will see you next quarter.
James Bradley:
Thanks everybody. See you next quarter.
DISCLAIMER: The foregoing content reflects the opinions of Penobscot Financial Advisors and is subject to change at any time without notice. Content provided herein is for informational purposes only, and should not be construed as investment advice or a recommendation regarding the purchase or sale of any security. There’s no guarantee that the statements, opinions or forecasts provided herein will prove to be correct.