
Market Commentary | January 2022
Market Review
Following a notably tumultuous 2020, there were hopes that 2021 would be calm. Perhaps on a relative basis it was, but the Capitol siege on January 6th set the tone for what would still be a long year. Despite hopes that the widespread distribution of COVID vaccines both in the US and worldwide would mark an end to the pandemic, mutations coupled with wide pockets of lower vaccine uptake have continued to send surges through the US and the world. Fortunately, each successive surge seems to be easier shaken off by the economy than the last, but volatility is still heightened by largely stimulus-produced inflation and exacerbated by pandemic-fueled supply chain issues. Despite the 40-year high in inflation, corporate earnings and personal income remained strong. ‘Meme traders’ manipulated stock prices from their sofas and cryptocurrency gained more mainstream acceptance and attention, with cryptocurrency market capitalizations topping $3 trillion. The U.S. economic recovery was highlighted by job growth and dwindling unemployment claims. Employment gains averaged over 550,000 per month in 2021, while weekly jobless claims fell to a 52-year low in December.
Despite mounting COVID cases, escalating inflation, labor shortages, supply bottlenecks, and severe weather that hit nearly every part of the country at one time or another, Wall Street continued to post gains. Large caps, small caps, growth, value — seemingly every market segment increased, surpassing most of the outlooks at the start of the year. While many factors contributed to the strong market performance in 2021, a few highlights include consistently favorable data pointing to ongoing economic recovery, strong corporate earnings throughout 2021, the acceptance of cryptocurrency as a mainstream investment, a low interest-rate environment, stimulus programs that provided consumers with cash, increasing job opportunities, and the availability of coronavirus vaccines. All of which resulted in the S&P 500 eclipsing its 2020 closing by nearly 27.0%, the Nasdaq rose by more than 21.3%, the Dow gained about 19.0%, the Global Dow advanced 18.6%, and the Russell 2000 climbed 13.7%. The fourth quarter was particularly robust for large caps, with the S&P 500 climbing 10.7% and the Dow advancing 7.4%. Each of the market sectors closed the year well above its prior year’s totals. Energy ended 2021 48.0% higher, followed by real estate (43.0%), information technology (33.5%), and financials (33.0%).
Long-term bonds, on the other hand, underperformed, particularly on inflation concerns, low interest rates, economic growth, and favorable stock performance. Ten-year Treasuries ended the year at 1.51%, up 60 basis points, the biggest annual rise since 2013. U.S. bond returns were down about 3.0%, well below other major bond markets. With the Federal Reserve likely to accelerate interest rates in 2022, 10-year Treasury yields are expected to push above 2.0% in 2022. Gold prices also were kept in check, closing the year roughly 3% lower than at the start of 2021.
Crude oil prices cratered in 2020, but surged with robust economic growth in 2021, surpassing a 2014 high of $80 per barrel, pushing up prices at the pump from an average of $2.25/gallon at the beginning of 2021 to $3.41 as the year ended. The dollar strengthened the most since 2015 against the currencies of several other countries, owing to expected interest rate increases by the Fed. For their part, the Fed started the year with a primary focus on continuing to allow easy monetary policy to continue the recovery from the pandemic-induced recession. However, by year’s end, the focus switched to inflation, which was less and less labeled ‘transitory’, and the bias turned swiftly from accommodative policies to a more hawkish outlook with 3 or more rate increases being telegraphed for 2022. We end the year largely where we started, with clear potential for improvement in the pandemic and service economy, but with risks that will likely contribute some volatility to the new year.
Economic Review
Employment: Job growth slowed in November with the addition of 210,000 new jobs, well below the 2021 monthly average of 555,000. The unemployment rate fell by 0.4 percentage point to 4.2%. The number of unemployed persons fell by 542,000 to 6.9 million. For comparison, in November 2020 the unemployment rate was 6.7% and the number of unemployed persons was 10.7 million. While both measures are down considerably from their highs at the end of the February-April 2020 recession, they remain above their levels prior to the coronavirus pandemic (3.5% and 5.7 million, respectively, in February 2020). Among the unemployed, the number of workers who permanently lost their jobs declined by 205,000 to 1.9 million in November, although this is 623,000 higher than in February 2020. The labor force participation rate edged up to 61.8% in November and is 1.5 percentage points lower than in February 2020.
FOMC/interest rates: The Federal Open Market Committee met in December and agreed to cut its asset purchase program by $30 billion per month beginning in January 2022, with the option of making similar reductions in the pace of asset purchases each month thereafter, unless the Committee determines an adjustment is warranted. The Committee decided to keep the target range for the federal funds rate at 0.00%-0.25%. The FOMC acknowledged that inflation is broad-based and attributed it to “supply and demand imbalances related to the pandemic and the reopening of the economy.”
GDP/budget: While the economy accelerated in the third quarter, it did not keep pace with the rate of growth in the second quarter. Gross domestic product increased at an annualized rate of 2.3% in the third quarter. GDP rose 6.7% in the second quarter. A resurgence of COVID-19 cases resulted in new restrictions and delays in the reopening of establishments in some parts of the country. Government assistance payments in the form of forgivable loans to businesses, grants to state and local governments, and social benefits to households all decreased. Consumer spending, as measured by the personal consumption expenditures index, rose 2.3% in the third quarter, well below the pace set in the second quarter (6.7%) and the first quarter (6.3%).
November saw the federal budget deficit come in at $191.3 billion, down roughly 32.0% from November 2020. The deficit for the first two months of fiscal year 2022, at $356.4 billion, is 20.5% lower than the first two months of the previous fiscal year.
Inflation/consumer spending: According to the latest Personal Income and Outlays report, personal income and disposable personal income both rose 0.4% in November after increasing 0.5% and 0.4%, respectively, in October. Consumer spending advanced 0.4% in November after increasing 1.4% the previous month. Consumer prices climbed 0.6% in November after increasing 0.7% in October. Consumer prices have risen 5.7% since November 2020.
The Consumer Price Index climbed 0.8% in November after advancing 0.9% in October. Over the 12 months ended in November, the CPI rose 6.8% — the largest 12-month gain since June 1982. Price growth was broad based, with all major categories showing an increase, led by gasoline (6.1%), energy commodities (5.9%), fuel oil (3.5%), and used cars and trucks (2.5%). Prices for food rose 0.7%, while prices for food at home increased 0.8%. Since November 2020, gasoline prices are up 58.1%, fuel oil has increased 59.3%, food prices have risen 6.1% (food at home has climbed 6.4%), while new vehicles (11.1%) and used vehicles (31.4%) also advanced.
Housing: Sales of existing homes increased 1.9% in November, marking the third consecutive monthly increase. Existing home sales dropped 2.0% from November 2020. The median existing-home price was $353,900 in November, the same price as in October. Unsold inventory of existing homes represents a 2.1-month supply at the current sales pace, a decline from both the prior month and from one year ago. Sales of existing single-family homes rose 1.6% in November following a 1.3% jump in October. Over the last 12 months, sales of existing single-family homes are down 2.2%. The median existing single-family home price was $362,600 in November, up from $360,800 in October.
Manufacturing: Industrial production rose 0.5% in November, advancing 5.3% since November 2020. Manufacturing increased 0.7% in November, reaching its highest level since January 2019. Over the past 12 months, manufacturing has increased 4.6%. Mining rose 0.7% in November, while utilities decreased 0.8%. November also saw new orders for durable goods increase 2.5%, advancing for six out of the last seven months. Durable goods orders inched up 0.1% in October. New orders for durable goods rose 21.5% since November 2020. Excluding transportation, new orders increased 0.8% in November. Excluding defense, new orders increased 2.0%. Transportation equipment, up following two consecutive monthly decreases, led the November increase, up 6.5%.
Imports and exports: Both import and export prices rose higher in November. Import prices rose 0.7% after increasing 1.5% in the prior month. Prices for imports have risen each month of 2021, except for a 0.2% decline in August. Since November 2020, import prices have advanced 11.7%, the largest 12-month increase since prices climbed 12.7% for the period ended in September 2011. Import fuel prices continued to increase, rising 2.0% in November. Import fuel prices have advanced 86.1% since November 2020. Excluding fuel prices, import prices rose 0.5% in November and are up 1.6% for the last 12 months. Export prices increased 1.0% in November after rising 1.6% in October. December 2020-November 2021 had export prices increase by 18.2%. This was the largest 12-month export price increase since September 1984, when data was first published. The international trade in goods deficit was $97.8 billion in November, up $14.6 billion, or 17.5%, from October. Exports of goods were $154.7 billion in November, $3.3 billion less than in October. Imports of goods were $252.4 billion in November, $11.3 billion more than in October. The November drop in exports was widespread, with only foods, feeds, and beverages increasing. On the other hand, each category of imports rose, led by industrial supplies, consumer goods, and automotive vehicles.
International markets: Despite several countries reporting record numbers of COVID-19 cases, global economic recovery has been fairly steady, as several nations around the world held off from imposing fresh lockdowns. Gross domestic product rose in several countries including the United Kingdom (6.9%), the Eurozone (5.2%), Germany (2.9%), Japan (1.6%), and China (7.7%). Crude oil prices dipped below $80.00 per barrel following their biggest rise since 2009. And stock markets were poised to close the year well above where they started in 2021. For 2021, the STOXX Europe 600 Index rose 22.3%; the United Kingdom’s FTSE advanced 14.3%; Japan’s Nikkei 225 Index climbed 4.9%; and China’s Shanghai Composite Index gained 4.8%.
Consumer confidence: The Conference Board Consumer Confidence Index® increased in December. The index stands at 115.8, up from 111.9 in November (revised). The Present Situation Index, based on consumers’ assessment of current business and labor market conditions, was relatively flat at 144.1 in December, down from 144.4 the previous month. The Expectations Index — based on consumers’ short-term outlook for income, business, and labor market conditions — increased to 96.9 in December, up from November’s reading of 90.2.
Looking Forward
The year 2022 should bring continued economic recovery. As the United States and the world inch slowly toward normalcy following the battle against the COVID-19 pandemic, stock markets, employment, and production should also advance. Inflationary pressures are likely to continue (although they will likely abate), which will most certainly prompt adjustments to the target range for the federal funds rate. Will President Joe Biden and lawmakers be able to reach an accord on a spending bill? Will the coronavirus continue to mutate and spread? The year 2022 is likely to provide another roller-coaster ride.
Back to Statistics 101
Statisticians look carefully for correlation when comparing potentially related series of data, and they measure the degree of correlation using ‘R2’, or the Coefficient of Determination. This number ranges from 0 to 1, with numbers closer to 1 indicating high degrees of correlation.
Sometimes, as in the chart below, you don’t need to calculate R2 to suspect some correlation between two data series; the relationship is visually obvious. 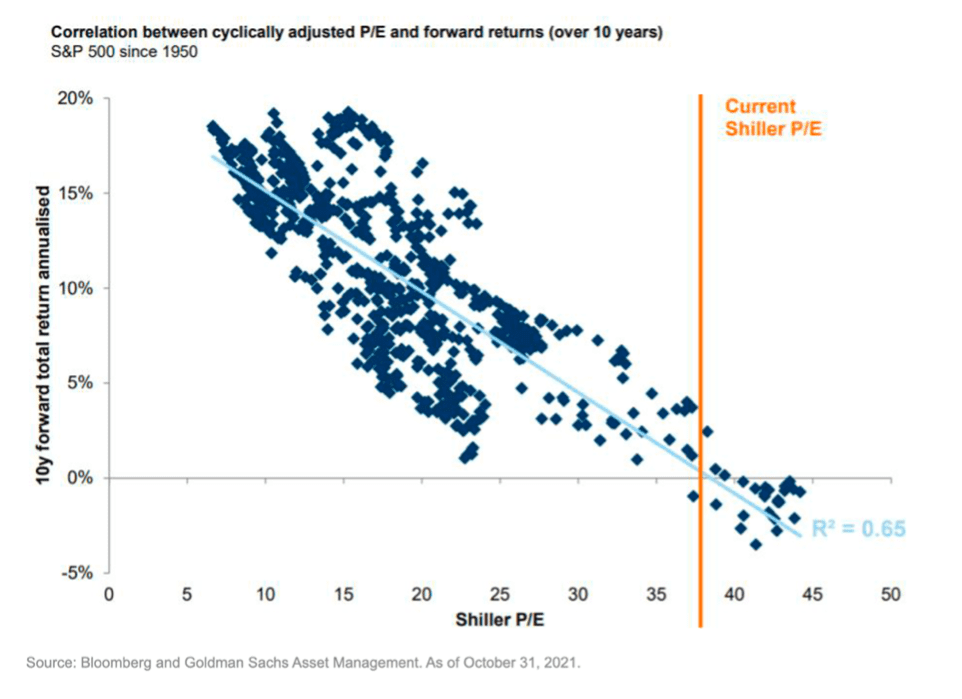
Such is the case when looking at the historical relationship between Shiller’s Price-to-Earnings ratio and the 10-year forward returns of the S&P 500. Clearly, higher P/E ratios have been associated with lower subsequent returns on the S&P 500. The regression function yields an R2 of .65, which statisticians would consider ‘statistically significant’.
A look at the October 31, 2021 measurement of the Shiller P/E leaves us with muted expectations for returns on the S&P 500 in the immediate future. While that may sound ominous, it is important to point out that the S&P 500, while a significant index, is not the whole market. Further, parts of the market may not be overvalued at all. And lastly, the extent to which valuations have been ‘stretched’ has not become worse over the year 2021. In fact, price-to-earnings multiples have actually contracted in the past year as earnings growth exceeded price growth. Could this trend continue as we (hopefully) emerge from the pandemic in 2022?
All eyes on inflation: Do we need to re-define ‘transitory’?
The Federal Reserve relies highly on the PCE Price Index for guidance on what it does with monetary policy (in other words, whether it will hike or reduce interest rates).
While the Fed started with the word ‘transitory’, use of the term has declined significantly in Fed communications, indicating that they no longer believe rising prices are just a short-term phenomenon.
However, monetary response to the current level of price increases may be measured, considering the moderate level projected by futures markets. Inflation is widely expected to decline by the second half of 2022.
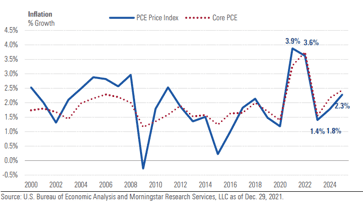
Inflation has been stoked by both supply and demand forces. Pent-up demand, coupled with stimulus money, has provoked a large run on consumer goods and durables like appliances and vehicles. Meanwhile, supply chain issues have been making these goods more difficult to come by. Both of these factors are widely expected to normalize somewhat in 2022.
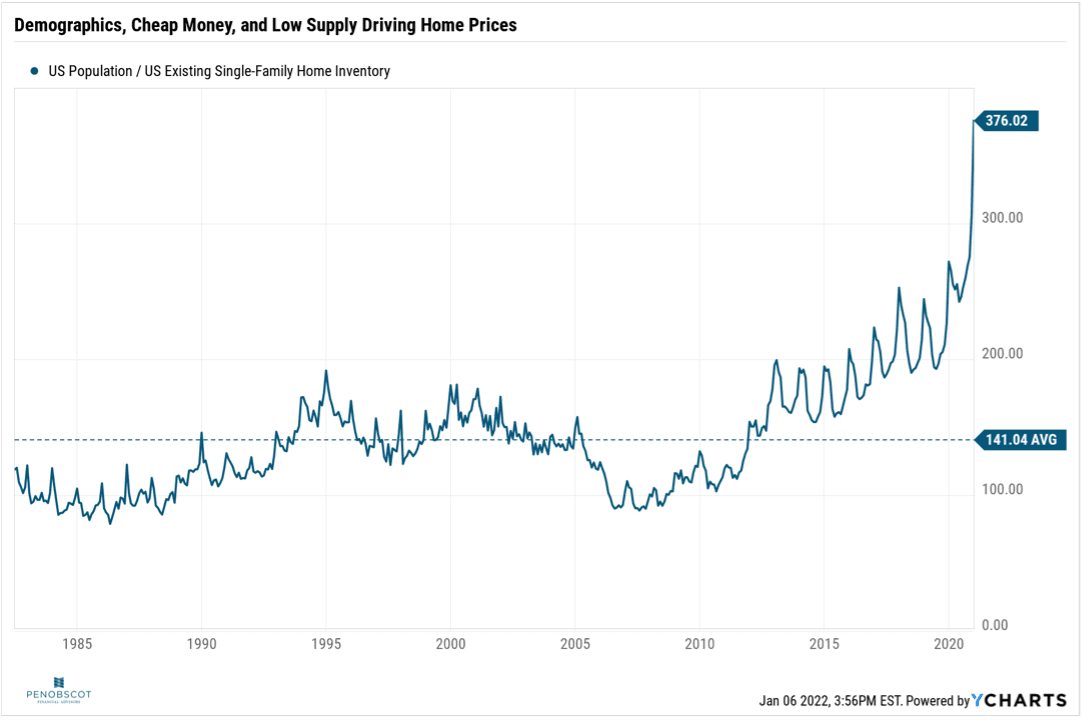
Housing is one area where prices may take longer to ameliorate. The inventory of houses on the market is at an historically low level. The long-term average is 141 people in the U.S. for each house on the market. Right now, that number exceeds 376.
Will rising rates tank the markets?
Historically, the direction of interest rates and the direction of stock and bond prices have been compelling for statisticians to watch. When looking at correlation between interest rates and capital market investments, an interesting dynamic seems to emerge. When the 10-year US Treasury Bond Yield is below 5% (and currently, it’s below 2%), correlations between interest rate changes and market prices have been overwhelmingly positive. When the rate is above 5%, the relationship has been significantly negative, with the short-term exception of the crash of 1987.
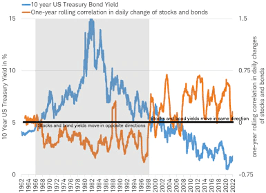
That indicates a possibility that stock and bond markets could very well endure the period of rising rates that is widely anticipated in 2022.
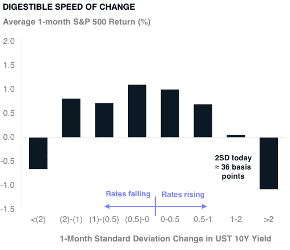
When it comes to the stock market, the SPEED of interest rate changes may have a greater impact on prices than the DIRECTION of these changes. Abrupt changes in either direction tend to be associated with negative returns on the S&P 500, while more moderate changes (or rate stability) has been seen to correlate more with stock price advances. If, when considering inflation, the Fed opts to move in slow increments to increase rates, this could bode well for stock prices.
Finding opportunity in challenging markets
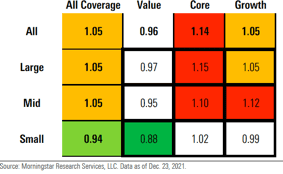
Morningstar routinely assigns ‘fair market values’ to markets and their constituent segments. While they find the overall market levels to be around 5 percent above fair valuations, there are parts of the market (notably value stocks and stocks issued by smaller companies).
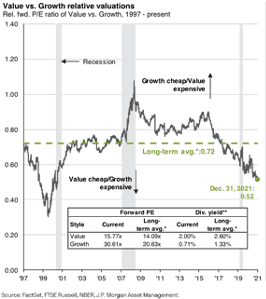
In fact, value stocks are looking about as cheap (relative to growth stocks) as they have since just prior to the ‘dot com’ crash of 2000.
Overall, 2022 is shaping up to be an interesting battle between bullish and bearish forces in capital markets. The bearish forces, inflation, interest rate increases, and extended valuations on significant parts of the market, will create headwinds. At the same time, however, we continue to see potential in the capacity and inclination of consumers to drive continued growth (even if not as rapid a pace as the last year and a half.). Which of these forces will prevail? Stay tuned.
Back to Stats 101
We started this commentary with some compelling evidence of correlation. Among them, the relationship between valuation levels and market performance, between interest rate movements and market performance, and between the speed of those movements and short-term market gyrations.
One last item that will begin to garner a lot of headlines will be the 2022 midterm ballots. Whereas we find some of the data statistically significant, we’d encourage people not to fret too much about the outcomes of these elections.
The data shows extremely little correlation between the outcomes of these elections and market movements.
We will continue to focus on diversifying as much risk away as possible, and attempt to take advantage of some of the compelling opportunities that still present themselves!
The foregoing content reflects the opinions of Penobscot Financial Advisors and is subject to change at any time without notice. Content provided herein is for informational purposes only and should not be used or construed as investment advice or a recommendation regarding the purchase or sale of any security. There is no guarantee that the statements, opinions, or forecasts provided herein will prove to be correct.
Transcription
Sam: Hi everybody. Welcome to the quarter 4 2021 PFA Investment Update coming to you from 25th of January as usual, joined by James Bradley.
James Bradley: Hi Sam.
Sam: How are you doing, Jim?
James Bradley: I’m doing great. Happy 2022.
Sam: Yeah, same to you. All right, keeping things fresh moving forward for you. Economic review, market review, looking forward, jumping right in with the economic review.
Biggest indicator of economic performance is GDP, showing how we fell below trend line there. Real nice V-shape recovery. This is as of quarter three, quarter four. JDP coming out next week. Should be getting even closer to that trend line. Just nice to know how long it took us to get back to that trend line after the ’08, ’09 financial crisis versus this recession, which was more self-imposed and therefore easier to unimpose. But there’s a price to be paid. A lot of this recovery had to do with stimulus coming from both the Federal Reserve and the fiscal side. And that price is, I’m sure everybody is aware, is inflation right now.
So the PCE price index up 5.73% annually as of November. December metrics are coming out pretty soon and shouldn’t be much changed from that value. So that’s an average of a basket of goods that everybody’s buying. It’s not consistent across every good.
Some of the big ones are energy costs and used vehicles, that type of stuff that’s really pushed things through the roof. So you might see something like core PCE reported elsewhere, which excludes some of those more volatile things like food and energy. But that’s where we’re at on the inflation front.
James Bradley: We know the Fed looks at that PCE index quite carefully and from where we are right now on the 25th, we’re just before the fed meeting, so we might… Everything that we say today might be old by the time it actually gets out there.
Sam: Yep. Always a risk. So everybody’s noticed the price is going up at the grocery stores and everywhere and feeling a little more strained on our pockets. But good news is more people are still having income than they otherwise would’ve if we didn’t have things like stimulus from the Federal Reserve, unemployment rate coming down from that high around 15, 16%. Now back to fairly normal levels at 3.9%.
Couple caveats of that participation rate is down lower than it was pre-pandemic. A lot of people were retiring earlier who were getting near the end of their careers anyway and just saw this is as a opportunity to get out of the workforce and not rejoin at the end. So not a huge, it looks like about a 2% down there, which doesn’t seem like a huge amount, but that’s 2% of a population of what, 350 million people or something like that.
James Bradley: It’s a lot of people.
Sam: A decent amount of people that are not rejoining the workforce. And then down on the bottom you can see the quits 4.52 million quits in the most recent report up near record highs. A lot of people reassessing what it means to work some of the jobs that they were working before. Now they’ve been at home spending more time with family and stuff like that and holding out for maybe something better that they’re looking forward to.
Not great for the economy, but not necessarily a bad thing for people’s mental health and wellbeing.
James Bradley: To hear the term, the great resignation. And this is the graphical indication of that, isn’t it?
Sam: Yeah, for the first time in a while, the supplier of labors have the upper hand on people who need to use labor, so they’re exercising that power and you see that in the form of rising wages to incentivize people to come back to work. So it’s an interesting dynamic going on.
James Bradley: It’s great. Yeah, looking at where we are now from the standpoint of January 25th, we’re on the verge, of hopefully, the peak in the next round of the coronavirus or the next variant of the coronavirus, and that’s the Omicron variant obviously, or the Omicron variant as I hear it referred to a lot.
Interestingly here, this is just kind of an index of the lockdown conditions that we see in with each successive wave and certainly picking up a trend there, aren’t we? The first wave, lots of lockdowns, second wave, not quite as many, third wave, not quite as many in Omicron here.
Again, every single iteration of this seems to lock down the economy less and less. As God willing, more of the population gets vaccinated, more of the population also actually gets infected and has some immunity that way and more therapeutics are available to keep people out of hospitals and diminish the need to close things down regularly.
This is becoming quickly, I’m thinking an endemic type of thing that we’re going to live with instead of a pandemic that we’re going to have to close down for, which is good to look forward to.
This normalization is further seen in a graph like this where we see how things like credit card transactions and that type of thing dropped a little bit really early on, but then they actually picked up to above pre-pandemic trends.
But gosh, look at the dive that things like seated diners and TSA traffic went through and those got close to being back to normal. Omicron pushed them back a little bit. But all good reasons to assume that those things, like indoor dining and people going on trips, travel trips, are going to get closer to normal. Actually, recreational travel I just heard this morning is really above trend as to where it was before the pandemic. It’s business travel that’s got a ways to come back.
Sam: Interesting. Yeah, things still trending in the right direction after those huge drawdown. I heard an interesting thought experiment lately, which was imagine if this pandemic had hit 15, 20 years ago when Amazon was still a bookstore and Zoom didn’t exist and that type of stuff. So from that perspective, a little bit of a silver lining that those tools that we needed came into existence just when we needed the most and has allowed us to bounce back fastly.
James Bradley: Thank goodness for Zoom.
Sam: And darn you Zoom. Best and worst thing that ever happened. All right, that wraps up economics. Moving over to the markets, Jim’s going to talk a little bit about asset class performance starting with commodities.
James Bradley: Sure, yeah. We always lead off with stocks. Why not mess it up and lead off with commodities this time.
Interesting. We see oil. Everybody kind of sees this when we’re looking at inflation numbers at the gas pump and that’s the kind of second derivative of this oil spike. And oil is an asset that you expect to increase in value, at least in our current energy consumption and usage dynamic when we’re seeing an economic recovery. And lo and behold, that’s the case.
And something more defensive like gold, which tends to be kind of a run to safety type of asset during that kind of a period, isn’t going to shine quite as much. So not surprisingly a little bit of disparity when it comes to commodities, but overall commodities have been a good place to be in 2021.
Stocks as well have, by and large, as we finished 2021 looking back, looking at the fourth quarter, looking at the 2021 as a whole, and gosh, looking back even at the last three years have been a good place to put your money. Looking at the fourth quarter, the one place that’s been a little bit challenging has been small-cap growth stocks and that’s been the case actually for the whole of 2021. Whereas large-cap blend seems to have been the category to be in. So if following this logic, Sam, why don’t we put all our money in large-cap blend stocks?
Sam: Because that would be considered chasing returns and technically is typically not a great way to make more money. And actually this next chart, great segue, it’s going to show about different asset class performances over time. It’s called a quilt chart, best-performing asset class for each year on the top versus the worst on the bottom here we see REITs were the best-performing asset class in 2021 in part because they’re becoming a great inflation hedge. But also look at the year they had last year, they were down pretty big and you can see bit of a pattern here. Things that are near the top tend to go down and vice versa, they flip around a bit. So just a good selling point for diversification here of not chasing returns into the thing that was the most profitable last year because it’s unlikely to be the most profitable again.
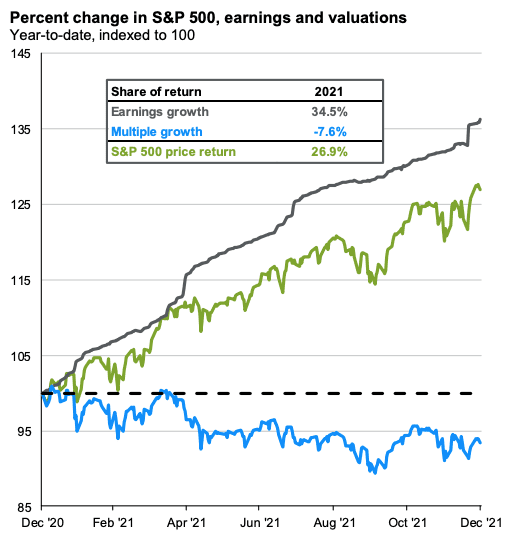
Little bit of a shift here talking about equity valuations big year in the S&P. Last year, 26.9% up, not purely speculation, this is showing earnings growth actually up 34.5%. So totally supported by earnings growth companies where there were some concerns they wouldn’t be able to protect their margins among amongst rising input prices and rising labor prices and that type of stuff. But they did a very good job protecting their margins and grew earnings 34.5% on average.
And the S&P actually underperformed that earnings growth because multiples cut smaller meaning the amount investors are willing to pay for dollars of earnings actually went down by 7.6%. So even though stocks had a big year up, they actually became cheaper.
James Bradley: It’s encouraging, I guess.
Sam: Looking forward. A couple of points of volatility here. A quick reminder that volatility can manifest in either direction. So don’t always let your mind go to the bad place.
For example, inflation, if it goes up more than expected in the next year, that’s going to be bad for markets. However, if inflation doesn’t come in as hot as people are expecting it to be, that’ll be very good for markets. And as kind of a derivative of that interest rates, if inflation is higher than we expect, interest rates are going to have to be risen faster versus if inflation isn’t as hot, interest rates won’t have to rise as fast and that’ll be good for stocks.
So these could come out either way. Federal Reserve meeting coming up here in a few minutes, looking at potentially three to four interest rate hikes this year. And market’s really been pricing that in.
So far this year I heard an interesting stat recently though that was more markets price in interest rate hikes, the less they’re actually probability to happen because financial conditions worsen as the stock market goes down. And then the Fed wants to protect that by not bracing interest rates at a time where the market’s all volatile. So a bit of an interesting correlation there.
Also put valuations on here, a little bit of caveat on that and that valuations themselves are not a catalyst for markets going down very fast or up very fast. They’re kind of misunderstood in that way. It’s more that high valuations mean a shock that’s not priced into the market is more likely to create a lot of volatility.
So, high valuations in themselves are not necessarily a bad thing. It just means if an unforeseen risk comes into play, market stands to lose more.
James Bradley: You’re much more likely to suffer a fall injury when you’re on the rim of the Grand Canyon than you are when you’re down in the Colorado River.
Sam: Nice analogy.
Geopolitics, a lot of people talking about Ukraine and Russia recently also, China is another one to keep an eye on. It remains to be seen if this actually becomes a big risk to the market. Lot of talk about it right now. Russia, in a lot of ways it’s kind of been boxed out of the global economy based on their behavior over the long term. But one place that they still do have a lot of influences in the energy markets, particularly oil. US has reduced their exposure to Russian and oil quite a bit, but Europe still is pretty exposed. So that’s an area to keep an eye on. And then with China, little bit of a continuing spat going on from pre-pandemic.
A lot of people talking about re-shoring, some of our manufacturing and stuff that is over there, especially in kind of critical supply chains. And there’s some human rights issues over there as well. Put it lightly I suppose. So those are some sources of volatility.
Talk about some sources of stability. Consumers and corporations remain very strong and there’s a lot of cash on the sidelines is the underlying factors here. Consumer credit scores actually went up during this last pandemic, which is very strange. That never really happens. People pay down a lot of debt. So debt payments are lower, more free cash flow, likewise both with the consumer and with corporations. Banks especially on very good footing. So much less of a systemic issue we had back in 2008 at a time like this where those balance sheets are looking strong and there’s 5.5 trillion of cash still on the sidelines.
A lot of that coming from the stimulus that is yet to make its way into the financial market. So that’s a lot of debt buying that could happen to support markets.
I’m going to kick it over to Jim now. He is going to take you to school on some stats.
James Bradley: Stats, yeah. Every once in a while we throw in some kind of a measurement or a ratio or a statistical measure that we just kind of brushed past. And I was going to bring one up here and I want to make sure I actually, for those who didn’t go to stats 101, or for those like me who did long enough ago to have forgotten everything from stats 101, we’ll talk about R squared.
R squared is called the coefficient of determination. Sounds really kind of ominous and very quant geeky, but at the end of the day it’s a friendly measure. It’s something that measures from zero to one, where zero meaning two different pieces of information, two different series of data have no correlation to one another. And one means that two series of correlation have perfect, no two series of data have perfect correlation with one another.
So to take a really kind of simplistic example, let’s look at the number of snowstorms that we have during this 2021, 2022 season.
I would suspect that if we have more snow storms, we will see that stores will sell more snow shovels. You can almost bank on that being a relatively highly correlated relationship.
So that correlation will probably be, that R squared will probably be a lot closer to one than to zero. Even in an inverse relationship though, if it’s perfectly inverse, then we’re still going to see that R squared at one. So like temperatures in the sales of mittens, the higher the temperature, the lower the sales of mittens and the lower the temperature the higher the sales of mittens.
So regardless of whether it’s a direct relationship or an inverse relationship, that R squared can be a pretty helpful number for us to look at in determining whether there’s a statistical significant relationship between two series of data.
And so this next slide gives us a chance to actually use that. And there’s this measurement, maybe we’ll use this one as a lesson for next quarter when we go through it called Schiller priced earnings ratio or Schiller’s PE, or Schiller’s cyclically adjusted price earnings ratio, whatever you want to call it.
Long story short, it’s just an indication of where prices are in the market relative to where earnings are. And right now that number’s relatively high, especially relative to historical norms. And if we graph out where that priced earnings ratio has been relative to 10-year forward returns on the market, you don’t have to be a really good statistician to be able to see that these dots kind of create a pattern and it’s an inverse pattern. The higher the PE ratio, the lower the following 10 year’s returns on average have been, there’s a lot of scatter among them.
You can’t make a really strong prediction on any specific number, but you can certainly get a trend there. So that’s one place that when we’re looking at numbers, and this is what statisticians do all the time, they’re looking at two different pieces of data to see if looking at one might predict the next.
And so one of the things that leads us, that we come to a conclusion on, looking at this is that we should be a little bit muted perhaps on what our expectations as to what the S&P 500 can deliver over the course of the next five or 10 years.
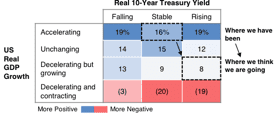
However importantly, that’s only part of the type of market where we put our money. And so if we see less opportunity in one place, we can always deploy it somewhere else. But in general, this is what we’re looking at, this is where we’ve been, when we see where treasury yields are and where the GDP has been growing.
We’ve been in a pretty aggressively accelerating economy. So GDP growth has been high and by and large, the Fed hasn’t really done much of anything with interest rates and interest rates haven’t really moved all that very much naturally on the 10-year treasury.
But now we’re getting into a situation where we think that those two things are changing, those dynamics are changing a bit. Clearly 10-year treasury yields, we think, are probably going to be in a situation where they’ll most likely be rising for the foreseeable future. And that GDP growth probably still growing. We’re not going into a recession anytime soon from everything that we can see. But that growth rate probably decelerating, so still the probability of getting decent returns from capital markets, but maybe not quite as outsized returns as what we’ve seen recently.
Sam: Thanks Jim. Yeah, definitely point. Good point that GDP growth starts out really quick and in recovery, early stage recovery and then seems like we’re getting almost to a mid-stage already where it’s decelerating but still growing, right?
Predictions are… We’re going to stay above trendline growth for the next few years, maybe three or four years. So that’s still very positive. It’s only when growth actually starts going negative that you get into recession talks and much scarier stock market returns. So we’re in this middle ground right now.
Finally on the final slide here we are coming towards the end of January, so I’m sure everybody’s aware that stock market’s been having a bit of a route so far this month. Bouncing back nicely today, and we’ll see what happens after the Fed meets this afternoon, but you probably heard a lot about corrections.
Definite definition of a correction is a 10% drop off the all-time hives of an index where a bear market would be a 20% drop or more.
This chart shows the times S&P since, it looks like 1950s come down off its highs and there’s been quite a few of them right now that the 7.69% we’re down doesn’t seem so aggressive as it probably seems looking at your account balances because we haven’t seen a drop like that since the coronavirus. And it’s actually abnormal that we’ve gone this long without a 10% correction.
Typically, they happen every one or two years. So not an uncommon thing, actually a pretty healthy thing for the markets. Bring some of those valuations back down to more reasonable average levels and kind of reset a baseline as we move forward.
James Bradley: And looking at it this way, 2020 looks like kind of a little garden variety correction.
Sam: Doesn’t it? Just a little blip on the radar. I wish it felt that way.
James Bradley: Yeah, so true.
Sam: Great. Well thanks for joining us. We’ll see you next quarter.
James Bradley: See you next quarter everybody.
The foregoing content reflects the opinions of Penobscot Financial Advisors and is subject to change at any time without notice. Content provided herein is for informational purposes only and should not be construed as investment advice or a recommendation regarding the purchase or sale of any security. There’s no guarantee that the statements, opinions, or forecast provided herein will prove to be correct.