
Market Commentary | May 2021
Summary
Market Review
We bid a fond farewell to 2020 with hopes that 2021 might be a ‘quieter’ year. January, however, had other designs. During the first week of the month, protesters stormed the United States Capitol, leading to violence, the disruption of the presidential election certification, and several deaths. Nevertheless, the inauguration of Joe Biden as our 46th president took place as scheduled. January also saw the emergence of virus mutations, the uneven distribution of COVID-19 vaccines, and the gradual relaxation of pandemic-related restrictions. Also during January, a new phenomenon in stock price manipulation emerged involving several companies, including the video-game company GameStop. Ultimately, stocks closed the month mixed, with the Russell 2000 and the Nasdaq gaining, while the Dow and the S&P 500 fell. Treasury yields, the dollar, and crude oil prices advanced.
Major equity indexes reached record highs in February, only to pull back by the end of the month. Fearful that inflationary pressures would mount, investors favored value stocks over growth, pushing small-cap and mid-cap stocks higher. Investors were encouraged by President Joe Biden’s $1.9 trillion stimulus proposal, accelerated vaccine distribution, and better-than-expected fourth-quarter corporate earnings. By the end of February, each of the benchmark indexes listed here posted gains led by the Russell 2000, which advanced more than 6.0%. The yield on 10-year Treasuries continued to grow, crude oil prices pushed past $61 per barrel, and the dollar rose. Only 50,000 new jobs were added in February, although unemployment claims decreased.
Stocks continued to push higher in March. Several of the benchmark indexes posted noteworthy gains including the Dow (6.6%), the S&P 500 (4.2%), and the Global Dow (4.0%). The Russell 2000 (0.9%) and the Nasdaq (0.4%) advanced moderately. Among the sectors, industrials (8.1%), utilities (7.4%), consumer staples (6.5%), and materials (6.4%) led the way. Treasury yields and the dollar advanced, while crude oil prices and gold fell.
Overall, the first quarter was definitely eventful. Federal stimulus payments lined many pocketbooks, a group of amateur traders banded together to decimate some hedge funds, interest rates jumped, inflation fears mounted, and the stock market produced robust returns. The small caps of the Russell 2000 gained nearly 12.5%, the Global Dow climbed 9.4% and the large caps of the Dow (7.8%) and the S&P 500 (5.8%) posted solid gains. Tech shares, which had driven the market for much of 2020, slumped during the quarter, but still gained enough ground to push the Nasdaq up by almost 3.0%. Energy shares posted some of the biggest gains in the quarter, with the sector surging over 30.6%. Financials jumped (18.0%), followed by industrials (12.0%), materials (10.8%), and real estate (10.0%). Only information technology failed to advance by the end of the quarter. The yield on 10-year Treasuries climbed more than 80 basis points. Crude oil prices ended the quarter at $61.50 per barrel, well above the December 31 price of $48.52. The price of gold finished March at $1,708.40 per ounce, significantly below its December 31 closing value of $1,893.10 per ounce.
Economic Review
Employment: There were 379,000 new jobs added in February after only 49,999 new jobs were added in January. In February, the unemployment rate fell by 0.1 percentage point to 6.2%, and the number of unemployed persons decreased by 150,000 to 10.0 million. Although both measures are much lower than their April 2020 highs, they remain well above their pre-pandemic levels in February 2020 (3.5% and 5.7 million, respectively). Among the unemployed, the number of persons on temporary layoff decreased in February by 517,000 to 2.2 million. This measure is down considerably from the recent high of 18.0 million in April but is 1.5 million higher than its February 2020 level. The number of employed persons who teleworked in February because of the coronavirus pandemic edged down to 22.7%, 0.5 percentage point lower than January.
Claims for unemployment insurance continued to drop. According to the latest weekly totals, as of March 13, there were 3,870,000 workers receiving unemployment insurance benefits, down from the February 20 total of 4,419,000. The insured unemployment rate fell 0.4 percentage points to 2.7%.
FOMC/interest rates: The Federal Open Market Committee met in March. According to the Committee statement, employment has turned up recently and, despite investor concerns, inflation continues to run well below 2.0%. The Committee continues to hold interest rates at their current 0.00%-0.25% target range and expects no changes through 2023.
GDP/Budget: The gross domestic product advanced at an annual rate of 4.3% in the fourth quarter of 2020. The GDP increased 33.4% in the third quarter after contracting 31.4% in the second quarter. Consumer spending, as measured by personal consumption expenditures, increased 2.2% in the fourth quarter after surging 41.0% in the third quarter. Exports advanced 22.3% in the fourth quarter (59.6% in the third quarter), and imports (which are a negative in the calculation of GDP) increased 29.8% in the fourth quarter, following a 93.1% increase in the third quarter. Personal consumption expenditures dropped 2.63%; nonresidential fixed investment declined 0.54%; residential fixed investment rose 0.23%; exports dropped 1.47%; imports rose 1.33%; and nondefense government spending advanced 0.15%.
The federal budget deficit was a larger-than-expected $310.9 billion in February, following January’s $162.8 billion deficit. The deficit is 32.0% higher than the February 2020 deficit of $235.3 billion. Through February, government outlays, at $559.2 billion, were 32.0% above the February 2020 figure, while receipts, at $248.3 billion, also increased 32.0%. The increase in government expenditures can be traced to a 125.0% jump in outlays for income security, an 859.0% increase in commerce and housing credits, and a 26.0% rise in health outlays.
Inflation/Consumer Spending: Inflationary pressures eased in February. According to the latest Personal Income and Outlays report, consumer prices edged up 0.2% in February after advancing 0.3% in January. Prices have increased 1.6% from February 2020. Excluding food and energy, consumer prices increased 1.4% over the last 12 months. Both figures are well below the Fed’s 2.0% target inflation rate. Personal income fell 7.1% in February after climbing 10.0% in January, and disposable personal income dropped 0.8% following January’s 11.4% jump. The decrease in personal income in February is primarily a reflection of stimulus payments received in January, which accounted for that month’s soaring income estimates. Consumer spending declined 1.0% in February after advancing 3.4% (revised) in January. Over the last 12 months, personal consumption expenditures (consumer spending) dipped 2.7%.
The Consumer Price Index climbed 0.4% in February following a 0.3% rise in January. Over the 12 months ended in January, the CPI rose 1.7%.
Prices that producers receive for goods and services continued to climb in February, increasing 0.5% after advancing 1.3% in January. Producer prices increased 2.8% for the 12 months ended in February, which is the largest yearly gain since climbing 3.1% for the 12 months ended in October 2020.
Housing: The housing sector retreated in February, likely due to dwindling inventory and rising interest rates. Nevertheless, sales of existing homes fell 6.6% in February after rising 0.6% in January. Over the past 12 months, existing home sales increased 9.1%. The median existing-home price was $313,000 in February ($309,900 in January), up 15.8% from February 2020. Unsold inventory of existing homes fell 29.5% from February 2020 and represents a 2.0-month supply at the current sales pace, slightly better than January’s 1.9-month supply.
New single-family home sales plunged in February. New home sales dropped 18.2% after climbing 4.3% in January. Sales of new single-family homes have increased 8.2% since February 2020. The median sales price of new single-family houses sold in February was $349,400 ($346,400 in January). The February average sales price was $416,000 ($408,800 in January). The inventory of new single-family homes for sale in February represents a supply of 4.8 months at the current sales pace, up from the January estimate of 4.2 months.
Manufacturing: The manufacturing sector took a step backward in February as industrial production decreased 2.2%, the first such decline since October. According to the Federal Reserve’s report, industrial production advanced 1.1% in January. Manufacturing output fell 3.1% in February following January’s 1.0% increase. For the first time in 10 months, new orders for durable goods decreased, falling 1.1% in February after climbing 3.5% in January. Transportation manufacturing led the decline, sliding 1.6% in February after posting five consecutive monthly increases.
Imports and exports: Both import and export prices rose higher in February for the third consecutive month. The February rise was the largest advance since import fuel prices increased 15.2% in July 2020. Import fuel prices rose 6.5% over the past year, the first 12-month advance since a 13.2% increase in January 2020. For the 12 months ended in February, exports have fallen 5.4%, while imports have jumped 10.1%.
The latest information on international trade in goods and services, out March 5, is for January and shows that the goods and services trade deficit was $68.2 billion, 1.9% over the December deficit.
International markets: Inflationary pressures may be ramping up globally. February saw consumer prices increase in several nations, including France, Germany, Italy, Canada, China, and Japan. In the markets, the EURO STOXX Europe 600 Index gained about 4.1% in March; the United Kingdom’s FTSE inched up 1.1%; Japan’s Nikkei 225 fell 1.3%; and China’s Shanghai Composite Index plunged nearly 4.0%.
Consumer confidence: The Conference Board Consumer Confidence Index® surged in March to its highest reading in a year. The index stands at 109.7, up from 90.4 in February. The Present Situation Index, based on consumers’ assessment of current business and labor market conditions, increased from February’s 89.6 to 110.0 in March. The Expectations Index, based on consumers’ short-term outlook for income, business, and labor market conditions, rose from 90.9 in February to 109.6 in March.
Looking Forward
Stimulus – then more stimulus
The run-up in US equity markets between election day and inauguration day was the largest we’ve seen for any such period. In addition, once the Georgia senate elections were settled, locking in the ‘blue wave’ of a democrat-controlled house, senate, and presidency, markets took yet another leg higher. It’s hard to argue that this was not the result of much higher expectations of fiscal stimulus at the hands of a Biden administration now empowered with the legislative backing that followed. As we head into the second quarter, markets seem to have already priced in not only the impact of the latest round of pandemic support, but also a mammoth infrastructure package, a combination of which should lead to more substantial growth of the US economy than we’ve seen in a long time.
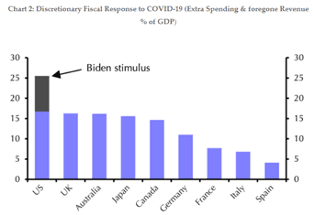
The extent of the pandemic recovery between the Trump and Biden administrations has now eclipsed in scope that of the other major western economies.
Vaccine vs. Variants
Further supporting further market growth will be the efficacy of vaccines in ending the COVID pandemic. While variants that seemingly result in increasing cases begin to emerge, driving total case counts higher, the widespread rollout of vaccines is having a significant impact in mortality from the disease. This is helpful because things like a vaccine failure or another spike in mortality are seen as possible shocks to the ongoing recovery.
Consumer Behavior
While we continue to see good improvement in areas of the economy, the reality is that the damage from the pandemic is going to still take a while to work its way out.
Employment
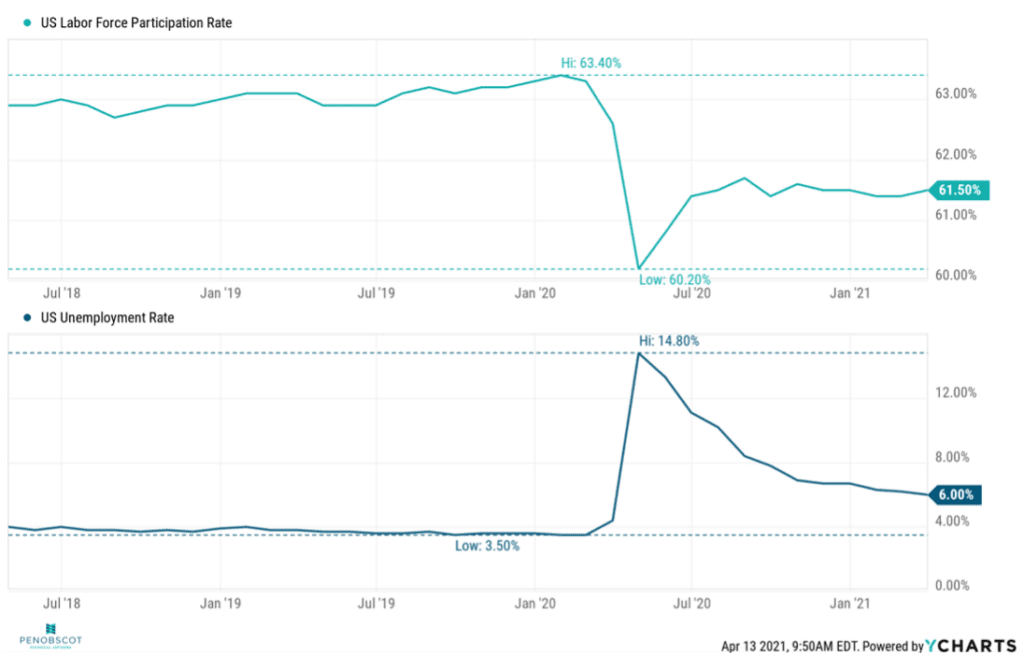
Labor force participation rate is still lower than pre-pandemic and unemployment is still at a relatively high level.
Stock vs. Bond Yields
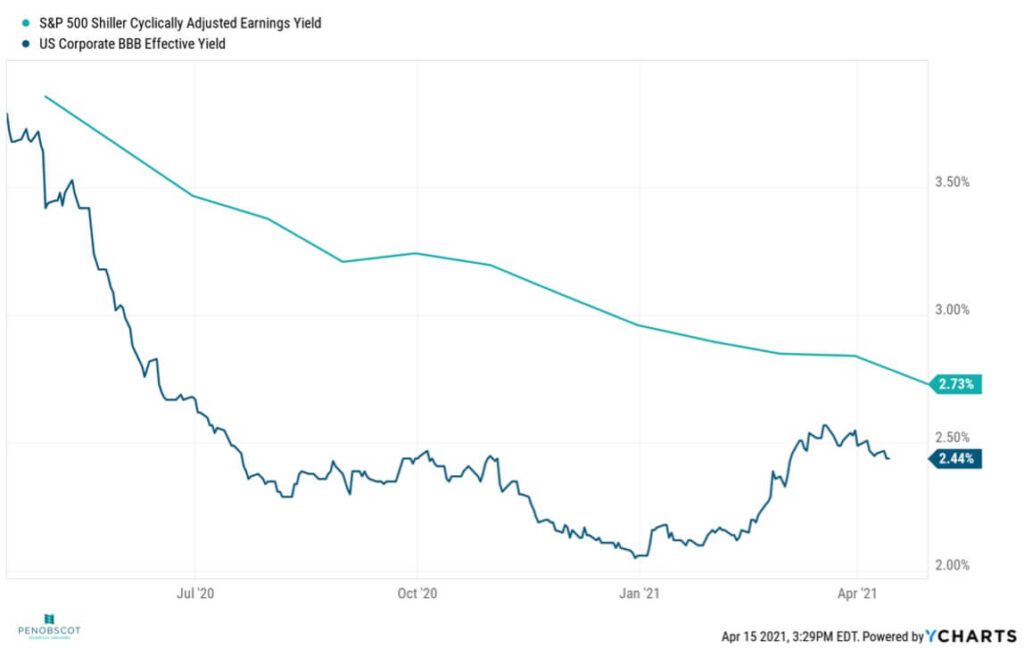
Another risk to this picture could arise if interest rates go up significantly. One factor supporting stocks over the past year is that yield is difficult to find in other areas. This has allowed stocks to retain high valuations relative to earnings. If earnings don’t manage to improve at their robust pace, and if yields increase on other investments like bonds, those forces could put stocks under pressure.
Inflation – Good or Bad?
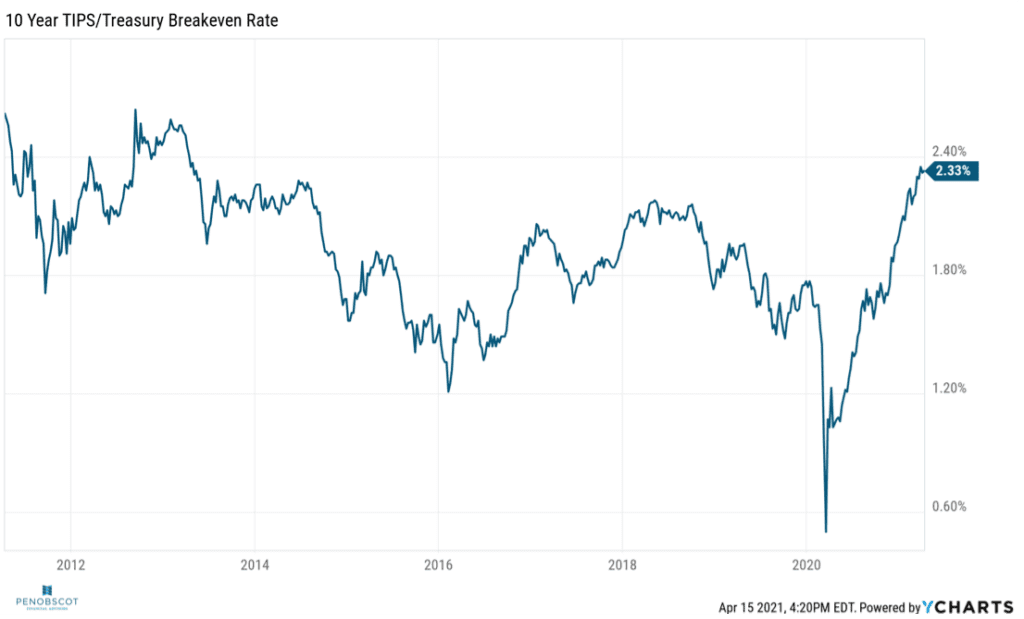
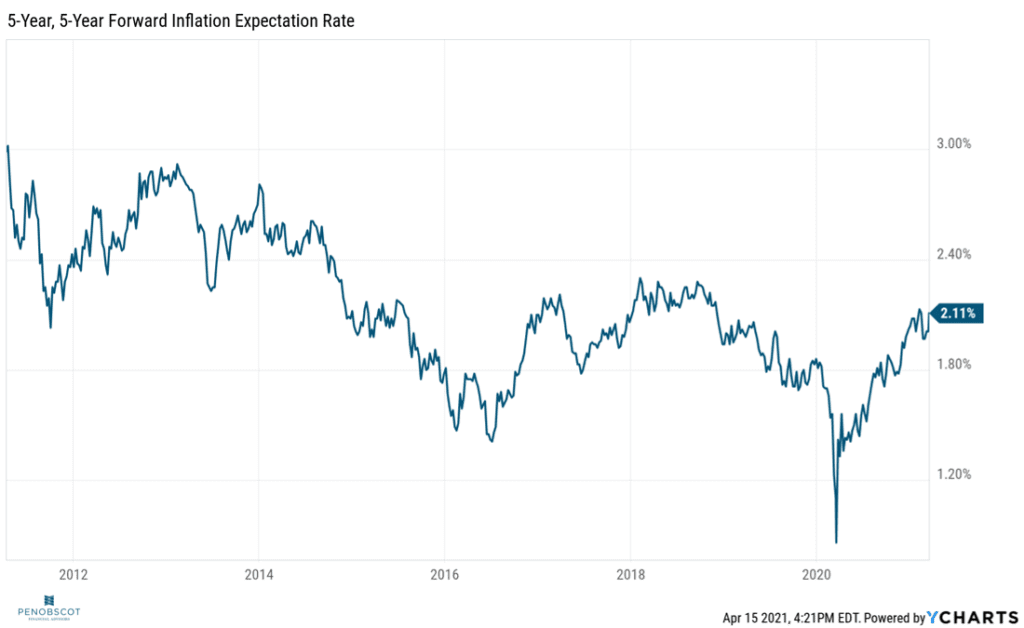 Inflation may be the greatest contributor to volatility in the second quarter. One of the primary reasons for this is that the Fed has promised to keep rates low for the foreseeable future and many in the markets are looking at that promise as a substantial tailwind for stock performance. If inflation increases beyond the levels already widely expected, it could force the Fed to raise interest rates sooner than later. Currently, however, there doesn’t seem to be a consensus view that we have significant inflation in our immediate future. Increasing production input costs indicate that consumer inflation is likely to run at a slightly elevated level in the near term. This is to be expected during a period of recovery from a recession. The FOMC has laid out the expectation that they are willing to let inflation run a little hot, and they don’t forecast that it will remain elevated. However, if inflation becomes more sustained at a higher level than is predicted in TIPS break-even rates and forward inflation expectations, the Fed may have to increase rates sooner than it is letting on.
The search for Yield in a tightening spread environment
While rising interest rates can have an impact on stock prices, both because they increase the costs of running a business where credit is involved and fact that they can make stocks less appealing in comparison to bonds, it is the fixed income category that is probably most directly impacted when rates go up.
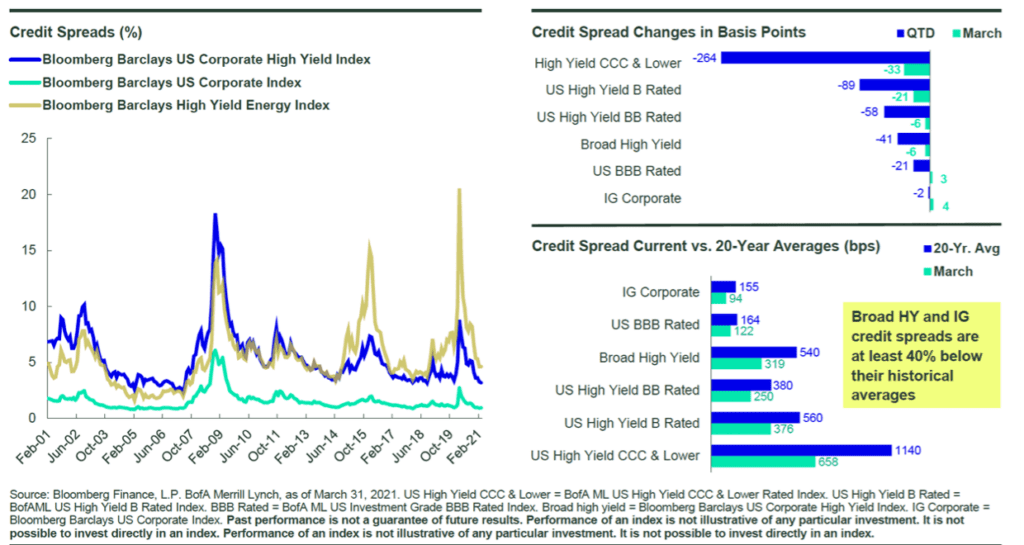
The Fed has some capacity to hold short-term interest rates down, but longer durations, as we’ve seen over the past few months, can climb independent of that. Still, rates across the board are low relative to historical norms. Not only are fixed income markets not rewarding longer durations very much, but they’re also not providing much of an incentive to take on credit risk. Credit spreads, the rewards we get for taking risk, have narrowed significantly in Q1.
 We continue to seek out opportunities to diversify into fixed income but are leaning further toward areas where risk is better rewarded and where duration is lower. Floating-rate senior bank loans and Treasury Inflation Protected Securities (TIPS) have some of these qualities. Additionally, non-US and Emerging Market debt provides opportunities to seek out areas where yield is higher and where a declining US dollar helps to magnify returns in dollar terms.
Now, more than ever, diversification is important within the fixed income sector. Given inflation risks, the most ‘secure’ investments may also be the most exposed to purchasing power risk.
Inflation hedging and diversification bolsters interest in alternatives
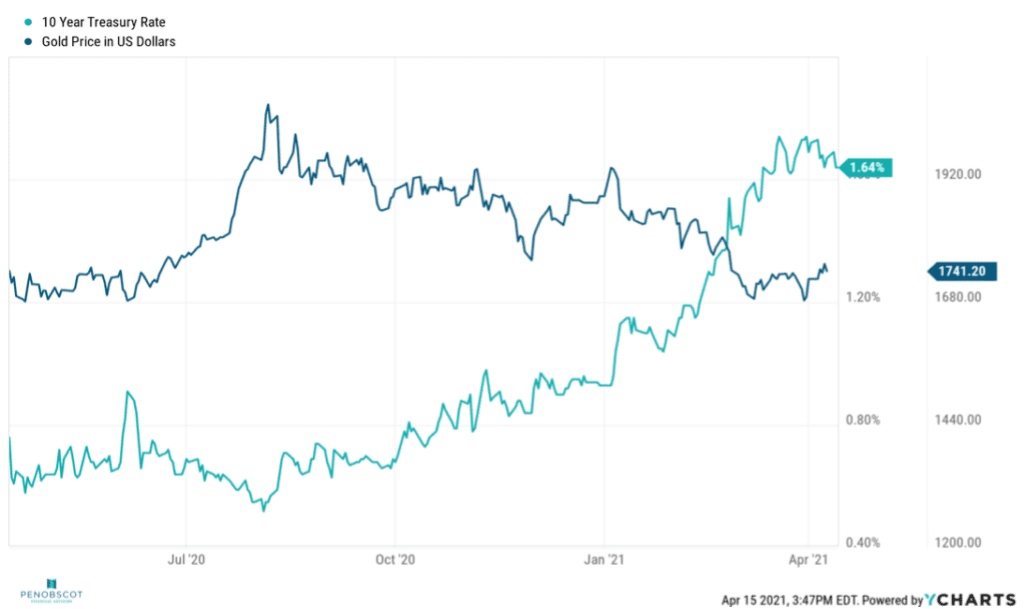
Commodity prices have been on a bit of a roll for the past two quarters. However, some assets, like gold, that have been seen as an inflation hedge have not held their value despite the building risk of inflation.
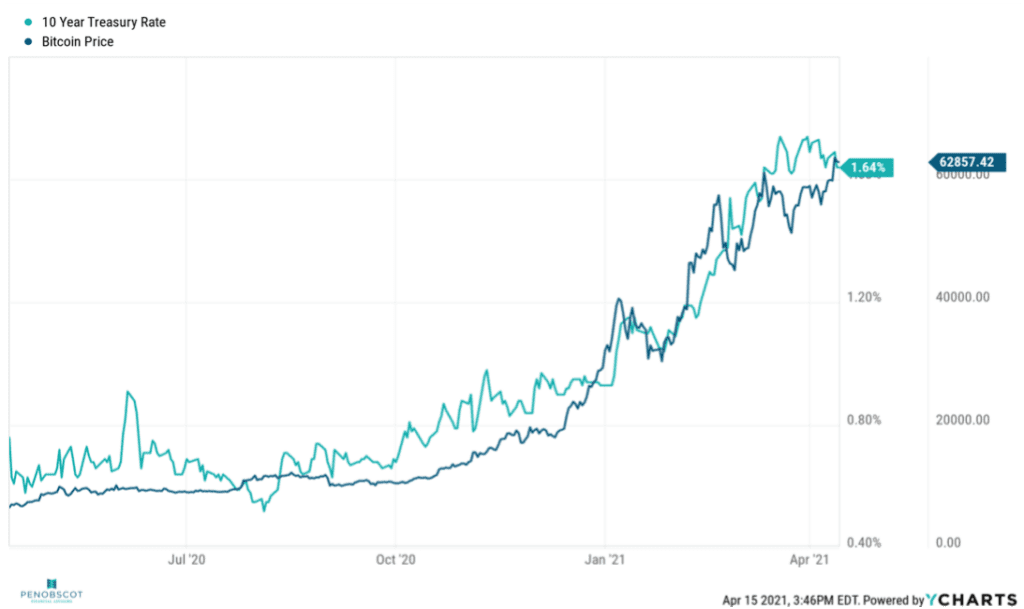 We continue to assess whether or not traditional stores of value like gold are becoming supplanted by virtual assets like Bitcoin. We’re not yet ready to identify which asset (gold, silver, Bitcoin, others) will become the dominant store of value in the world, but it is difficult to ignore the current trend with virtual currencies providing their holders with a wild valuation ride, but arguably with some ability to be used as a defensible inflation hedge.
DISCLAIMER: The foregoing content reflects the opinions of Penobscot Financial Advisors and is subject to change at any time without notice. Content provided herein is for informational purposes only and should not be used or construed as investment advice or a recommendation regarding the purchase or sale of any security. There is no guarantee that the statements, opinions or forecasts provided herein will prove to be correct.
Transcription
Sam Chaplin: Hello everybody and welcome. We’re coming to you from end of April reviewing first quarter of 2021 here. My name is Sam Chaplin. I’m the associate portfolio manager at Penobscot financial advisors joined by our founder and chief investment officer and advisor, James Bradley.
James Bradley: Good afternoon, Sam.
Sam Chaplin: Welcome James, how are you?
James Bradley: I’m doing great. How are you doing today?
Sam Chaplin: I am doing well, thank you. Can’t believe it’s been another quarter already.
James Bradley: Alrighty and a month.
Sam Chaplin: Yup. So follow the same format here. Economic review, market review, and looking forward, trying to keep it nice and concise for you. So we’ll hop right in with the economic review. First slide here is a bit of a chart showing a bunch of leading indicators in the economy. The most recent quarter will be in the left-hand side there we’re seeing in first quarter of 2021, nearly every leading economic indicator is showing a positive change from the quarter before.
Sam Chaplin: The only one that didn’t is the S&P 500, because it only returned 6% in the first quarter instead of 12%. So I’m willing to pass on that one, give it a slide this time. Otherwise, a bunch of good economic data coming out in the first quarter that really booyed the market’s higher. You can see manufacturing and retail sales in particular were big boosts to the economy and that’s manifested in the S&P 500, where hopes are pretty high at the moment. And you’re seeing the S&P earnings estimated to show the biggest increase in a quarter since at least 2004. Not surprising coming out of a few bad quarters, but it is good to see that the rebound is materializing and in quick order, a lot faster than some initially expected. A report came out yesterday of GDP for the first quarter at an annualized rate of 6.4%, which is above estimates. Initially they were estimating forecasting that we would reach pre pandemic levels of GDP in 2023 at the soonest. And now we’re looking like 2022 we’ll be back in trend line with the GDP growth there. Some pretty positive developments on that front.
James Bradley: Been a while since we’ve seen any numbers like that.
Sam Chaplin: Yeah, for sure. And then that’s shown in the market as well. This next slide is going to show mutual fund ETF flows, and you can see the big draw down there. People pulling their money during the downturn and has returned to normalized levels. A lot of cash on the sidelines too. A lot of liquidity in the system that’s kind of been sloshed around through different areas, largely in part due to the stimulus on the fiscal side and support and printing money on the monetary side.
James Bradley: Yeah, that stimulus is a big part of why all that money is sitting out there in bank accounts and corporate coffers as well. If we look at where the US stands in terms of how much fiscal fuel they’ve added to the fire here of recovery relative to the other Western democracies, we were already leading. And that was before this most recent, additional stimulus that has come into place under the Biden administration and not necessarily related to COVID specifically, but the infrastructure package that’s starting to kind of percolate its way through Congress is going to add more on top of that. This is really unprecedented. This is an amount of stimulus that we haven’t seen certainly in my lifetime being, being put on the economy and that’s… And a lot of times folks are asking why is that happening?
James Bradley: And one of the reasons is that despite what you might see when you kind of look out your front door, the labor market has improved, but if you kind of dig a little bit beyond the surface there, there are still some stressors and some kind of damage that continues to kind of run out in a long tail. So we look at the US unemployment rate. 6% is not all that very bad, and that’s where we are right now. But obviously it’s not the record lows that we were seeing before we went into the pandemic. Job force participation was at near record highs. It’s certainly off of the low point, but not where… Certainly not back to where we were. The U six unemployment rate, which is the bottom graph that you see here, is inclusive of people who aren’t necessarily included in the unemployment rate, because they’re no longer essentially seeking jobs.
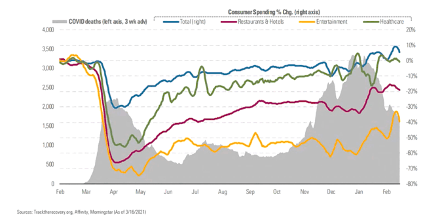
James Bradley: They’re discouraged job seekers. And that is probably a better estimate of where we are. And that’s still, again, above where we were pre pandemic. So there still is the need for stimulus. There still is the need to support the economy. Question is what’s being done in line with what’s needed and… Or does it go too far or not far enough? And that’s a question to be discussed by policymakers, not us, but beyond that is when we can talk a little bit about risks that build as a result of that when we get into the looking forward part of the session today. Going to the next slide, looking at consumer behavior, not surprisingly as the third wave ebbs, and as you know, things start to kind of look a little bit more normal, we can see that things like restaurants and hotels, entertainment, healthcare, they’re certainly on the up swing. They’re not back, especially in the entertainment portion, to where they were pre pandemic, but steady progress there and not surprisingly so that it’s not back to where it was beforehand, but no reason to doubt that that’s the direction we’re heading in those areas.
Sam Chaplin: Thanks, Jim. Yeah, the fiscal stimulus in the US was certainly a big tailwind for domestic stocks relative to international ones this quarter, as we’ll see in the market review. One of the interesting things to note here about this chart is that even though GDP has bounced back quite a bit, there’s still a large part of unemployment, a lot of employment that hasn’t bounced back yet, but the rest of the wave, those really high face-to-face sectors, think restaurants, only account for a small portion of GDP, about 6% of GDP, but 15% of employment. So it’s expected that we’ll see a solid bounce back in employment as the rest of the reopening occurs.
James Bradley: Right. That’s always been kind of a disconnect for me, and you can see it there pretty plainly that the GDP numbers are belying the underlying kind of weakness in the job market, but also, like you say, that’s something to be optimistic about as that section of the economy comes back online.
Sam Chaplin: Absolutely. So moving into the market review, first chart here is called the quilt chart. Aptly named. Shows the different asset classes performance. The most recent quarter on the left side and then going back in time towards the right, and you can see the commodities are one of the top performers in the most recent quarter, coming off some bad performance in preceding quarters. US small caps did really well. US value did really well. Quite a value coming back so far this year, but these charts are always just a good way to show that diversification pays and being concentrated in one of these areas, it can be feast or famine sometime, but as long as you maintain a nice asset class mix, you should make some nice returns over time.
James Bradley: Yeah. Lots of times you see the one area that was at the top one quarter is the one at the bottom the next quarter, and vice versa. So kind of interesting to watch. Equity valuations, this is where if you’re at the water cooler and the person next to you is saying that the market is vastly overpriced and poised for a collapse, they might be looking at this kind of a chart because looking at where we are right now, price, as it relates to earnings, is pretty extended. Especially if you’re looking at trailing earnings numbers. Not terribly surprising. The market has come back. I wouldn’t just say quite a way, all the way. And yet earnings, if you’re looking at them in the rear view mirror, are not all that very exciting. So that ratio of price to earnings is at an historically high level, some would say, and looking at this graph here, even higher than the “dot com” bubble back in 2000.
James Bradley: So should that be a concern? Our point is probably not such a concern. Sam, you did a great job of adding the forward operating PE ratio estimate that takes into account the fact that the denominator in that fraction, the earnings part, is going to come back, obviously in some way, shape or form. There’s no real doubt about that. And the question is just how much does it come back. Do earnings supersede where they were pre pandemic, or do they kind of fall short of coming back to where they think they’re going to be?
James Bradley: As far as the estimates that we’re seeing here, they go up enough so that even at today’s price levels, it supports a more average valuation multiple there. If we look at another metric, which is price to book ratio, which tends to be a little bit less subject to business cycles, we’re seeing still above the long run average of valuations, but there compared with the previous chart, well below what we saw in the dot com bubble. So are stocks cheap? I think that that’s up to just about anybody to answer. I think you and I would agree Sam, that they don’t look really cheap, but they do not look like they’re in kind of bubble territory.
Sam Chaplin: Yeah. When we see those estimates for earning growth going forward higher than they’ve been in a long time, that supports some higher valuations and it hasn’t just been segments. The market has kind of rallied in phases, especially in the S&P and that’s what we see on this next chart about breadth, which is showing the number of stocks in the S&P or percentage of stocks rather in the S&P above their 200 day moving average, which is simply just taking the average of the last 200 days prices. Are you above that price? Are you below it? To indicator of momentum and momentum is at record highs. You can see almost a hundred percent of the stocks are trading above their 200 day moving average. Didn’t all happen at once though. It’s been interesting to see how the rally has occurred.
Sam Chaplin: First kind of the tech and stay at home stocks were rallying out of the bottom of the market, and then came in the large caps, which were a little more insulated from the cyclical cycle and then people got optimistic. Vaccine rollout started happening. We’re going into cyclicals, let’s get airlines, lets get cruise lines, stuff like that. And now interest rates start rising because inflation expectations are going up a little bit among other factors. And now people are looking at energy and financials, which do well there. Anyway you kind of think of it like a race where you’re handing off the baton to the next race and to take the rally the next step higher. But at this point, breadth is huge. For a while there, it was just the tech guys doing well. And now everybody seems to be participating.
James Bradley: All the relay runners are kind of running next to each other now, if you want to carry out that visual.
Sam Chaplin: Thank you for helping me out there. And then outside of the S&P is the small caps here on the next slide have been really outperforming the last two quarters, fourth quarter of 2020, especially and the first half of first quarter of this year. And you can see it’s justified in this graph, looking at forward earnings, compared to the large caps in the S&P have just really rebounded. They were hit the hardest by COVID having to shut down a lot more often, had a lot of reasons that going concern is more of a concern in a downturn for the small caps, but they bounced back really well.
James Bradley: This next slide here on stock and bond yields, kind of… We can go back to what we were talking about in a previous slide where price earnings ratios are higher than they’ve normally been. And even forward projections still kind of keep them maybe a little bit higher than their longer term averages and not to get too quant or math geeky, but a price to earnings ratio, if you flip that upside down and make it an earnings to price ratio, you’re talking about earnings yield, and this is a good graph that kind of shows that earnings yield on stocks. How much you’re getting as a kind of an earnings rate of return for holding stocks. And that gives us the S&P 500 Schiller, what they call Cape yield, number, cyclically adjusted price to earnings number. Or the inverse of the cyclically adjusted price earnings number.
James Bradley: And it importantly compares it to where else in the market can you put your money? So when we see higher price to earnings ratios on the stock market, that necessarily means lower earnings yields, but in the kind of rate environment we’ve been in, that has certainly been justified. So those higher stock prices kind of have some justification behind them. This also, however, can be a little bit of a cautionary slide, right? Because you’re looking at a fixed income yield number, and there we’re talking about the triple B effective yield or the lowest quality investment grade, highest quality junk type of yield there that could compare with stocks when it comes to how volatile they are. Their yield has been getting a little bit closer to the S&P yield. And as a result of that, the concern starts to creep up as to what if yields continue to increase?
James Bradley: Does that start to push, put a little bit of pressure on stock prices as a result? So something we do want to watch, but it also, again, another validator, I guess you could say Sam, about the level of stock prices where they are now. There’s this acronym that we hear from a lot of people these days, TINA, that just basically means there is no other alternative. Where else are you going to put your money to get any yield? And the answer when it comes to the fixed income area or the bond area is nowhere terribly exciting.
James Bradley: We can see that credit spreads, in other words, how much you’re rewarded for taking on credit risk in the bond markets have compressed really substantially. And that, frankly right now, you’re just not getting quite as much reward for taking on any credit risk at all. And that in the areas where there is less credit risk, we’re still seeing record or near record low yields in those areas. So continue to expect that from the standpoint of the fixed income markets, as both a dynamic that we’ve got to try to be creative as to how we get around when we’re investing fixed income market money, but also frankly, a supporter as long as yields can stay low of extended stock valuations like we’re seeing now.
Sam Chaplin: Yeah. And to follow on that, we get a slide here showing how the yield curve has changed over the past year, where the blue line is where the yield curve was a year ago. Yellow line is three months ago. Green line is today, and you can see quite a steepening happening there on the short end of the curve. The fed has been pretty well standing on the short shortest term end there.
Sam Chaplin: They’re almost near 0% with those interest rates, but we can see the steepening in the yield curve, especially at the short end, and that’s raising interest rates from a high level of interest rates is bad for stocks, but historically rising interest rates from really low interest rates is a good thing for stocks because that means the economy is recovering. So, and that’s a steepening of the short end is also a little bit of inflation being priced in there as a result of the fiscal stimulus and borrowing. And we’ll get into that a little more with the looking forward, but just interesting to see how the curve has changed and where people are pricing in that inflation. And you can see it’s very much so at the short-term end and can be transitory as the fed is telling us it’s going to be.
James Bradley: Speaking of looking forward.
Sam Chaplin: Speaking of looking forward, let’s look forward.
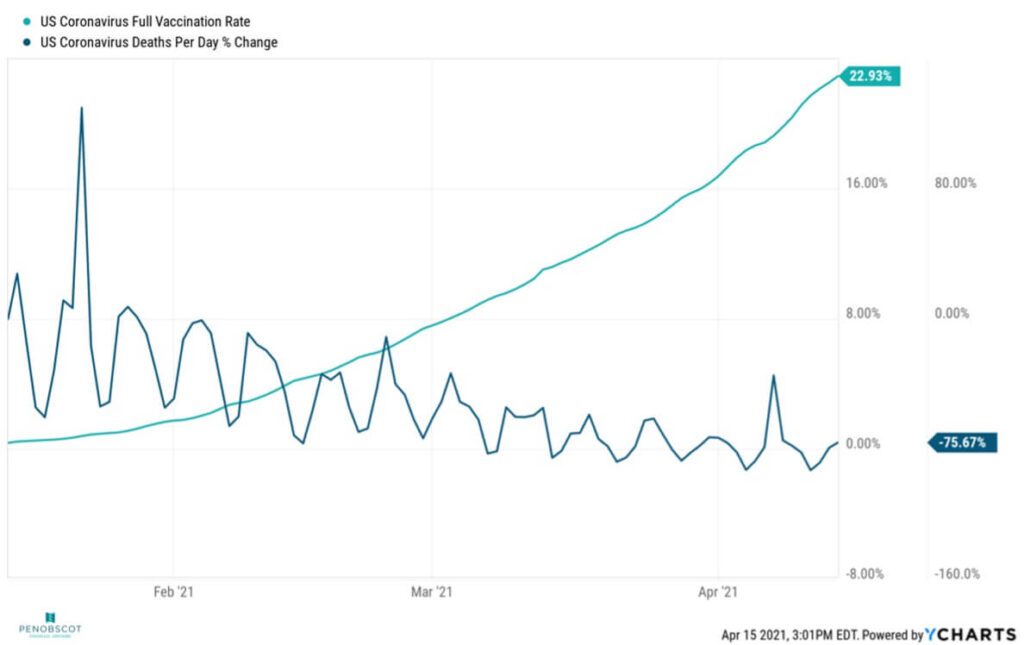
Sam Chaplin: I think I’ll set you up here, Jim, with looking forward, we’re going to talk a little bit about the vaccine rollout and then just some of the risks of continued growth now that the Coronavirus is kind of ebbing. People are looking for the next narrative in the market. What’s going to be the next thing to look out for? What are the risks we see coming? So talk a little bit about that and kick it off with the vaccine variants here, vaccine and variants, rather, we can see that full vaccination rate is up to 29%, over 29% as of pretty recently in the US. I think a lot of people probably saw that Maine is leading the way in the vaccination, ring-
James Bradley: Good going, Maine!
Sam Chaplin: Which is something to be proud of.
James Bradley: Yeah.
Sam Chaplin: I’d like to think it has everything to do with us being nice and virtuous people and nothing to do with us being the oldest state in the country. But anyway, that’s a good thing either way. And then over that time, we’ve seen the death rates per day really drop off. So the vaccine is working. If anybody doesn’t think so, you can show them this chart.
James Bradley: Certainly, yeah, with the exception of certain flare ups across the globe, I think, without exception, you’re not going to find too many people that don’t see a positive trend emerging there and something that is going to lead us out of where we’ve been from an economic standpoint. So how can we throw water on that? I guess one way that we can look at it is, gosh, all of this stimulus. Everything that’s that we’ve used to kind of get through this has really left us with a pretty substantial credit card bill as a nation and you can see on this chart where we’ve had a pretty stunning jump in the public debt as far as a percentage rate change. Importantly, at today’s interest rates, another thing to look at is that while the interest payments on that debt have increased, they certainly haven’t increased nearly as much.
James Bradley: And that has obviously a lot to do with what Sam was just talking about with the lower interest rate environment that we’re in. So it not only creates less of a concern, but also more of a risk down the road and we did see interest rates go up. So I think you’ll see market volatility pick up when you start to see any sense of upward movement on interest rates, at least to the extent that those upward movements exceed what the market’s kind of already priced in. If they can… The market’s frankly not dumb, it’s priced in the fact that interest rates are going to go up. So it’s more a matter of how are they moving relative to expectations. Also kind of related to that is inflation because as more assets are coming, as more liquidity comes into the economy and chases goods and services, inflation is expected to pick up.
James Bradley: And there’s almost no doubt in anyone’s mind this time around that we will see inflation. I’ve been expecting inflation to pick up significantly for the last 15 years and it hasn’t, but right now we’re seeing all of the inputs to that calculation picking up. And so the question is, does that become a concern? Because at some point that ties into interest rates. The fed has to start raising interest rates to ward off hyperinflation. Well, we’re not terribly concerned about that. Looking at the numbers here, the 10 year tips to treasury breakeven rate is kind of an indication as to where the market sees average inflation over the course of the next 10 years. And at 2.31%, it’s a little bit above where the fed would target their inflation rate, but the fed also is emphatic about the idea that they’re looking for a symmetrical approach to managing inflation.
James Bradley: So to the degree that it’s been well below that kind of 2% target, that doesn’t really seem to be causing them a lot of concern. They’re willing to let it run a little bit hot for a temporary period of time. And the fed also is emphatic that they think that that is a temporary dynamic that eventually we kind of get back into the longterm trend.
James Bradley: The next slide here kind of plays that out. If you kind of go five years into the future and then map out the five year forward inflation expectation rates, so over the course of the next 10 years, take the second half of that, they’re showing an inflation rate that’s even lower than that average part over the 10 years. So general consensus, at least as the markets are looking from an expectation standpoint at a temporary minor increase inflation followed by a little bit more normality. The important thing there is that we’re going to get the inflation that we’re going to get, not what’s being projected. And if that number comes up to be a higher number than is expected, as surprise inflation starts to kick in, that’s something that could rile markets as well. So it’s something we’re looking at really closely.
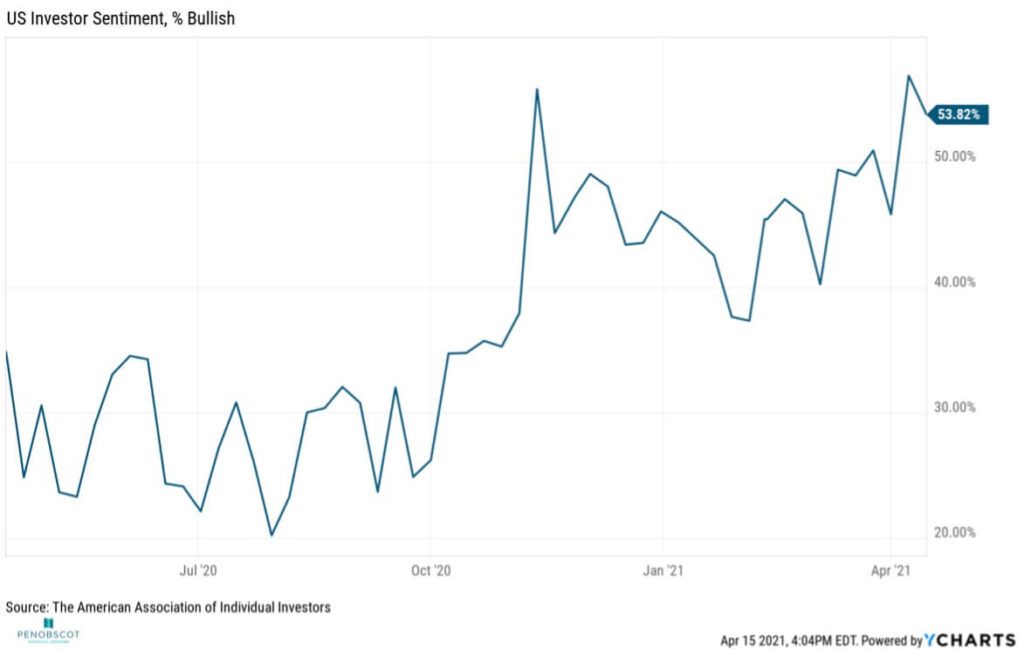
Sam Chaplin: Yeah, I think inflation is the next big narrative that everybody’s talking about. And these charts demonstrate that so far, people have a lot of confidence in the federal reserve kind of buying what they’re selling as far as letting things run a little bit over 2% for a while, and then coming down over the next 10 years. If anybody wants to dig deeper into inflation, we did just release a podcast. So I’ll sneak in a quick, quick plug there. You can go check out our inflation podcast, but I think that just about wraps up everything other than a happy note to end on.
James Bradley: Yeah. That’s I think a good way to do this now that we’ve bummed you out about inflation is the “beach stocks”. So looking back about a year ago, what would be the best things to invest in? And if we look at this chart, the S&P 500 has certainly been a nice place to be, up almost 50% over that period of time. But gosh, if you were able to have some creative forward looking ideas and look at the things that had been most hurt, things like booking companies, entertainment, airlines, the things that are going to take us to the beach, Sam, are the things that have really knocked the cover off the ball over that period of time. So a little bit of a happy thought that summer is coming around and that we’re maybe going to be able to get out there and enjoy ourselves a little bit more than we did last summer. And a good object lesson in that you really want to be buying the things that people are vastly too scared to holding their portfolio at any given time, because usually that’s the place to be.
Sam Chaplin: Yup. Should have called that slide hindsight 20 20.
James Bradley: 20 20.
Sam Chaplin: Well, thanks for joining us everybody. Hope you enjoyed it. Check out the rest of our videos and subscribe if you’d like, and we will see you next quarter.
James Bradley: See you next quarter. Bye.
Disclaimer: The foregoing content reflects the opinions of Penobscot Financial Advisors and is subject to change at any time without notice. Content provided herein is for informational purposes only and should not be construed as investment advice or a recommendation regarding the purchase or sale of any security. There’s no