Market Commentary | October 2021
Summary
Market Review
Overall, the third quarter was a roller-coaster ride for the market. The Dow, the Russell 2000, the Nasdaq, and the Global Dow lost value, while the S&P 500 was able to eke out a quarterly gain. Treasury yields, the dollar, and crude oil prices ended the third quarter higher. Financials, information technology, communication services, and health care sectors ended the quarter in the black. Conversely, energy, industrials, and materials fell by at least 4.5%. Despite the downturns, the benchmark indexes remain well ahead of their 2020 closing values, led by the S&P 500, which ended the quarter nearly 15.0% over last year’s pace. The yield on 10-year Treasuries fell 30 basis points. Crude oil prices increased $14.17 per barrel, or 24.0%, in the third quarter. The dollar weakened by nearly 1.0%, while gold prices advanced 3.6%. The national average retail price for regular gasoline was $3.175 per gallon on September 27, up from the August 30 price of $3.139 and higher than the June 28 price of $3.091.
July kicked off the third quarter with large caps outperforming small caps. The S&P 500, the Dow, and the Nasdaq advanced, reaching record highs along the way, while the small caps of the Russell 2000 fell over 3.5%. Treasury yields, the dollar, and crude oil prices also declined. Gold prices advanced. By the end of the month, over 80% of the S&P 500 companies that reported earnings exceeded expectations. COVID cases surged as the Delta variant spread across the country. Inflation figures continued to rise. The Consumer Price Index rose 0.9%, the Producer Price Index climbed 1.0%, both import and export prices advanced 1.0%, and retail sales increased 0.6%. The Federal Reserve noted that the economic recovery remained on track. Second-quarter gross domestic product advanced at an annualized rate of 6.5%, according to the initial estimate from the Bureau of Economic Analysis. Health care led the market sectors, followed by real estate, utilities, information technology, and communication services. Financials and energy lagged.
Equities continued their strong showing in August, recording several record highs during the month. Strong corporate earnings reports and improving economic conditions helped bolster investor confidence, despite the increasing prevalence of the Delta variant. Growth stocks outpaced value shares. Financials and communication services led the market sectors, while energy lagged. The Nasdaq paced the indexes, climbing 4.0%, followed by the S&P 500 (2.9%), the Russell 2000 (2.1%), the Global Dow (2.1%), and the Dow (1.2%). Ten-year Treasury yields jumped 7 basis points to close the month at 1.30%. The dollar rose by 0.6%, while crude oil prices fell 7.2% to $68.51 per barrel on the last business day of the month. Gold prices changed little, trading at $1,817.50 per ounce. The jobs sector improved, adding 943,000 new jobs. Wage gains were strong, while unemployment claims dipped.
Following a strong July and August, September saw the market struggle with volatility. Traders had other concerns to deal with, including slowing economic growth, elevated inflation, supply-chain disruptions, a global energy crunch, and China’s regulatory restrictions. In addition, investors are facing the prospects of the Federal Reserve beginning to wind down its stimulus measures. Each of the benchmark indexes lost value, with the Nasdaq falling more than 5.0% and the S&P 500 dipping 4.8%. Among the market sectors, energy climbed 8.5%, while the remaining sectors ended well in the red. Crude oil prices rose more than 9.0% to close the month over $75.00 per barrel. The dollar and 10-year Treasury yields advanced, while gold prices declined.
Economic Review
Employment: The pace of job gains slowed in August, as 235,000 new jobs were added, well off the pace set in July (943,000) and June (938,000). Through the first eight months of the year, monthly job growth has averaged 586,000. The unemployment rate declined by 0.2 percentage point to 5.2% in August. The number of unemployed persons edged down to 8.4 million, following a large (782,000) decrease in July. Both measures are down considerably from their highs at the end of the February-April 2020 period. However, they remain above their levels prior to the COVID-19 pandemic (3.5% and 5.7 million, respectively, in February 2020). In August, notable job gains occurred in professional and business services, transportation and warehousing, private education, and manufacturing. Employment in retail trade declined. Among the unemployed, the number of permanent job losers declined by 443,000 to 2.5 million in August but is 1.2 million higher than in February 2020. The number of claims for unemployment insurance fell in September. According to the latest weekly totals, as of September 18 there were 2,802,000 workers receiving unemployment insurance benefits, down from the August 14 total of 2,862,000. The unemployment rate for the week ended September 18 was 2.0%, down 0.1 percentage point from the August 14 rate of 2.1%.
FOMC/interest rates: The Federal Open Market Committee met in September. While noting that the economy has continued to recover, the ongoing spread of the coronavirus, particularly the Delta variant, may be slowing the pace of recovery. With the goals of maximum employment and inflation running at 2.0%, the Committee decided to maintain the current target range for the federal funds rate at 0.00%-0.25%. However, the FOMC indicated that it may begin scaling back its purchases of securities as early as this November.
GDP/budget: According to the third and final estimate from the Bureau of Economic Analysis, the economy accelerated at an annual rate of 6.7% in the second quarter of 2021 after advancing 6.3% in the first quarter. Consumer spending increased 12.0% in the second quarter after rising 11.4% in the prior quarter. The personal consumption price index (prices for consumer goods and services) rose 6.5% in the second quarter after climbing 3.8% in the first quarter. Excluding food and energy, the price index increased 6.1%. In the second quarter, fixed investment climbed 3.3% following a 13.0% increase in the first quarter, and residential fixed investment fell 11.7% after increasing 13.3% in the first quarter. Exports rose 7.6% in the second quarter after decreasing 2.9% in the first quarter. Imports (which are a negative in the calculation of GDP) increased 7.1% in the second quarter (9.3% in the first quarter).
The Treasury budget deficit was $170.6 billion in August following the July deficit of $302.1 billion. Following the latest increase, the budget deficit through the first 11 months of the current fiscal year widened to $2.7 trillion, roughly 10.9% lower than last year’s deficit over the same period. Compared to last fiscal year, government expenditures have increased 4.0% to $6.3 trillion, while receipts have increased 18.0% to $3.6 trillion.
Inflation/consumer spending: The Consumer Price Index climbed 0.4% in September, following a climb of 0.3% in August and a 0.5% jump in July. Over the 12 months ended in September, the CPI rose 5.9%. Prices less food and energy rose 0.1% in August, the smallest increase since February 2021. Energy prices increased 2.0%, mainly due to a 2.8% rise in gasoline prices. Food prices increased 0.4% (0.7% in July), and new vehicle prices rose 1.2% (1.7% in July). Over the 12 months ended in September, energy prices have risen 24.8%, food prices have increased 4.6%, and prices for used cars and trucks have climbed 24.4%. Prices that producers receive for goods and services continued to climb in August, increasing 0.7% after rising 1.0% in both June and July. Producer prices increased 8.3% for the 12 months ended in August, the largest yearly gain since November 2010 when 12-month data was first calculated. In August, prices for services rose 0.7% (1.1% in July), and prices for goods moved up 1.0% (0.6% in July). Producer prices less foods, energy, and trade services advanced 0.3% in August (0.9% in July) and have risen 6.3% since August 2020, the largest 12-month increase since August 2014.
Housing: Existing home sales fell 2.0% in August following two consecutive monthly gains. Over the past 12 months, existing home sales dropped 1.5%. The median existing-home price was $356,700 in August ($359,900 in July), up 14.9% from August 2020. Total housing inventory at the end of August dropped 1.5% from July’s supply and is down 13.4% from one year ago. In August, unsold inventory sat at a 2.6-month supply at the present sales pace, the same figure recorded in July but down from 3.0 months in August 2020. Sales of existing single-family homes also decreased in August, falling 1.9% after increasing 2.7% in July. Year over year, sales of existing single-family homes fell 2.8%. The median existing single-family home price was $363,800 in August, down from $367,000 in July. Despite the recent monthly increases, sales of new single-family homes have decreased 24.3% from August 2020.
Manufacturing: Industrial production increased 0.4% in August after advancing 0.8% (revised) the previous month. Late-month shutdowns related to Hurricane Ida held down the gain in industrial production by an estimated 0.3 percentage point. Manufacturing output rose 0.2% in August after rising 1.6% in July. In August, mining fell 0.6%, reflecting hurricane-induced disruptions to oil and gas extraction in the Gulf of Mexico. The output of utilities increased 3.3%, as warm temperatures boosted demand for air conditioning. Total industrial production in August was 5.9% higher than its year-earlier level and 0.3% above its pre-pandemic (February 2020) level. New orders for durable goods increased 1.8% in August after advancing 0.5% in July (revised). Transportation drove the August increase, with new orders climbing 5.5% after decreasing 0.4% in July.
Imports and exports: August import prices increased 0.4% in September, after decreasing in August by 0.3%, the first decline since October 2020. Import prices rose 9.2% over the 12 months ended in September, the smallest 12-month increase since March 2021. The August downturn in fuel prices was mostly driven by a 2.4% decline in petroleum prices. Despite the decline in August, import fuel prices advanced 56.5% for the year ended in August.
The international trade in goods deficit was $87.6 billion in August, up $0.8 billion, or 0.9%, from July. In August, exports increased $1.1 billion, or 0.7%, while imports rose $1.9 billion, or 0.8%. For the 12 months ended in August, exports have risen 25.6%, while imports have increased 17.8%.
The latest information on international trade in goods and services, out September 2, was for July and showed that the goods and services trade deficit decreased by 4.3% to $70.1 billion. July exports rose 1.3%, while imports declined 0.2%. Year over year, the goods and services deficit increased $131.0 billion, or 37.1%, from July 2020. Exports increased $205.0 billion, or 16.8%. Imports increased $336.0 billion, or 21.3%.
International markets: Whether it’s ‘transitory’ or not remains to be seen, but several countries are experiencing accelerated inflation. Germany, Europe’s largest economy, saw inflation grow at a record pace in September, climbing 4.1% following a 3.4% jump in August. French inflation hit a near 10-year high of 2.7% in September. Like the case in many countries, surging energy prices are driving the inflation spike in France. Nevertheless, if inflation continues to climb, pressure will be on the European Central Bank to determine how to proceed with its asset purchases going forward. China, the world’s second largest economy, is attempting to contain the financial fallout from the default or bankruptcy of mega-developer Evergrande. Also last month, the People’s Bank of China, which has targeted bitcoin since 2013, declared that all crypto-related activities are illegal in China.
Consumer confidence: Consumer confidence waned considering the spread of the Delta variant and concerns about growth prospects in the short-term. According to the latest report from The Conference Board, consumer confidence declined in September for the third consecutive month. The Consumer Confidence Index® stands at 109.3, down from 115.2 in August. Nevertheless, consumer confidence is still high by historical levels, while these declines in confidence suggest consumers have grown more cautious and are likely to curtail spending going forward.
Looking Forward
Looking ahead to the final quarter of 2021, plenty of competing indicators make it difficult to predict where markets will end up. Real estate and manufacturing slowed from the pace set earlier in the year. GDP posted strong data for the second quarter, although some estimates suggest that the third quarter will not be quite as strong. On the jobs front, there are nearly 11 million jobs available but nearly 8.7 million unemployed actively looking for work, further widening the gap between job openings and hires.
Murmurs of the ‘S’ word
The past few quarters, all eyes have been on a buildup in price inflation – and data is bearing that out. What’s more recent is a developing trend of lower-than expected economic growth, largely due to slowdowns surrounding the expansion of the delta variant and the slowing in the production of goods and services, owing to supply chain constraints. Fears of inflation exceeding expectations while simultaneously seeing slower economic growth have led some to toss about the term ‘Stagflation’. This insidious combination of ‘Stagnation’ and ‘Inflation’ goes back to the 1970s when unemployment ran high during a period of increasing inflationary pressure, something previously considered unlikely. Most economists would argue that we are not in such a condition right now. In order to get there, inflation would need to substantially exceed expectations, and economic growth would need to stall more than has been seen. Still, that’s the very thing they’re watching closely.
Currently, relative to the 1970s, the rate of inflation appears tame. Fed chair Jerome Powell expresses an opinion shared by many economists, that the recent increase in prices will be a temporary phenomenon.
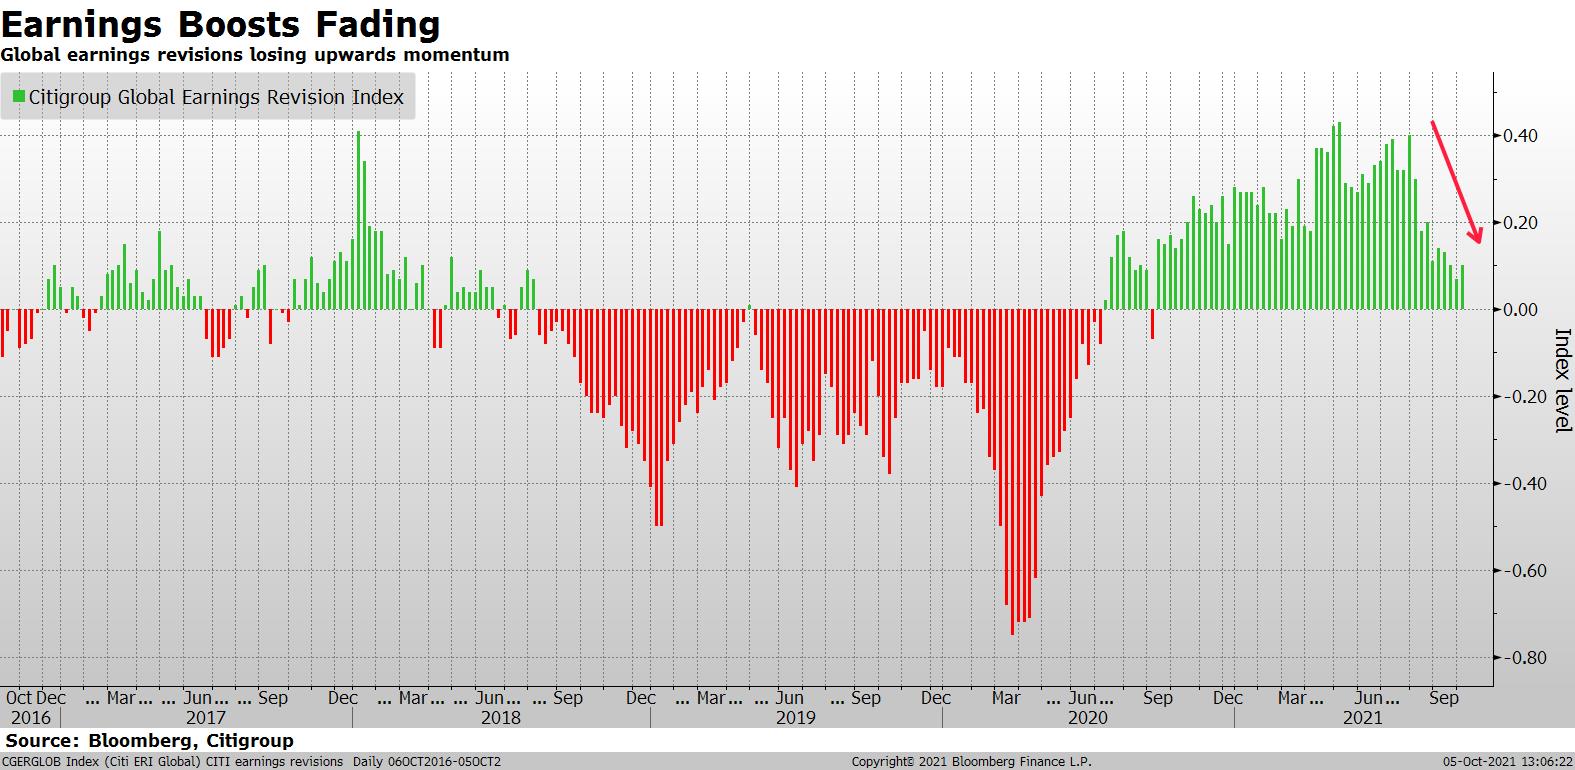
While risks of accelerating inflation weigh heavily on market participants, concerns also exist that the recovery from COVID lockdowns may be slowing or stalling. Earning revisions are still trending higher, but the magnitude of upward revisions has been steadily declining since summer, creating concerns that growth will stall out at the same time as inflation increases.
While economic growth is widely expected to moderate off of the current very high levels, there are expectations that the ongoing trend in domestic GDP growth will settle in to a pre-pandemic range around the year 2025.
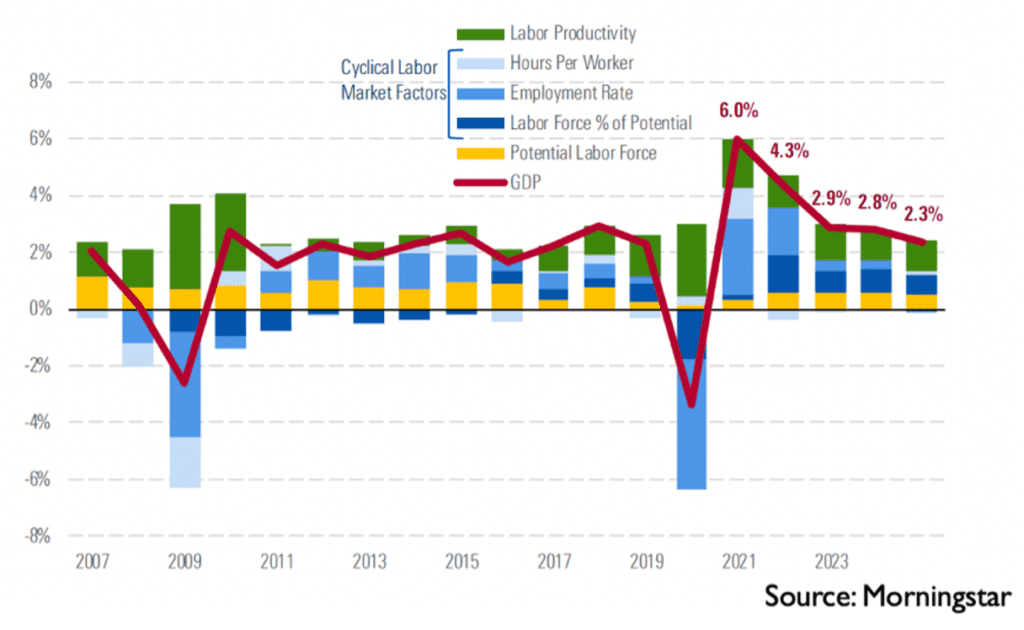
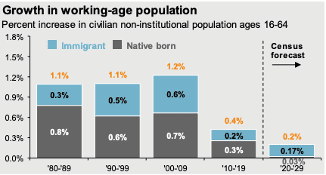
One way of looking at GDP growth (growth in the production of goods and services domestically) is to consider it as the aggregate output of the working population. That population can be approximated as the civilian non-institutionalized population aged 16-64. Growth in that population group has been slowing steadily as baby boomers retire. Over the upcoming decade, only approximately 0.2% growth is expected in the working age population in the US (and over the upcoming decade, that growth is expected to be made up entirely of immigrants.).
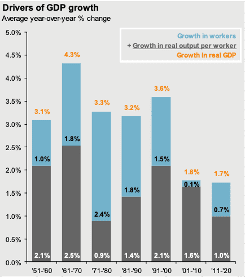
Combining the growth of the working-age population with growth in their average ability to produce goods and service (productivity), you get the total GDP growth for the country. While it’s unlikely that GDP growth will go very low in the short-term, it is also difficult to predict it going much higher than forecast, given these demographic challenges. (Charts courtesy of JP Morgan, Guide to the Markets)
Beware Valuations
Market indices like the S&P 500 reached valuations (relative to earnings) that hadn’t been seen since the 2000 ‘dot com crash’. While higher price-to-earnings ratios (P/E) are often considered justified during low interest rate environments, and while these multiples did end the quarter off their highs, there are areas where valuations seem more reasonable than what we’re seeing in large domestic stocks currently.
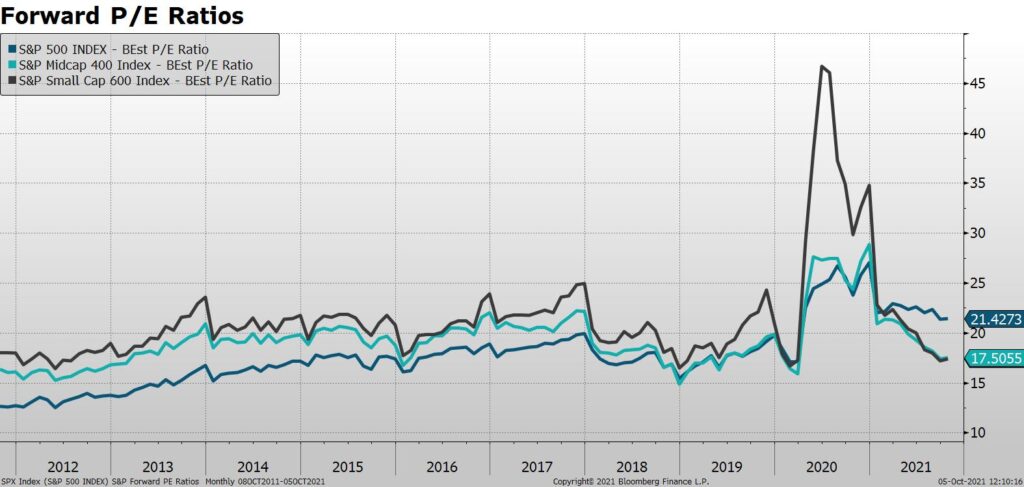
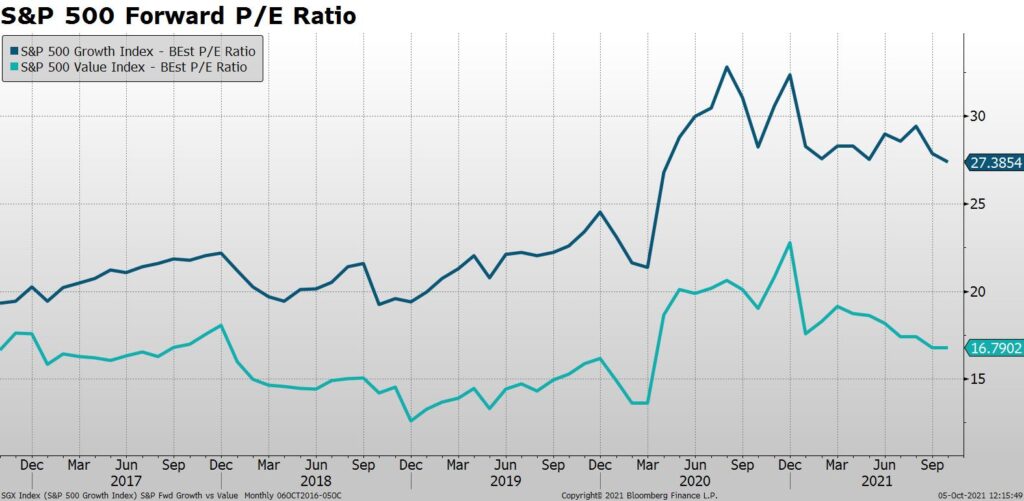
Stocks of smaller and mid-sized companies are priced at earnings multiples that seem a bit more ‘in line’ with their historical averages, while Large Cap stocks remain at higher-than average Price-to-Earnings (PE) multiples.
Within the larger companies, those that make up the S&P 500 Growth index are priced at significantly higher valuations than they have in over a decade. Stocks from the S&P 500 Value index are priced at levels that fall more in line with recent averages.
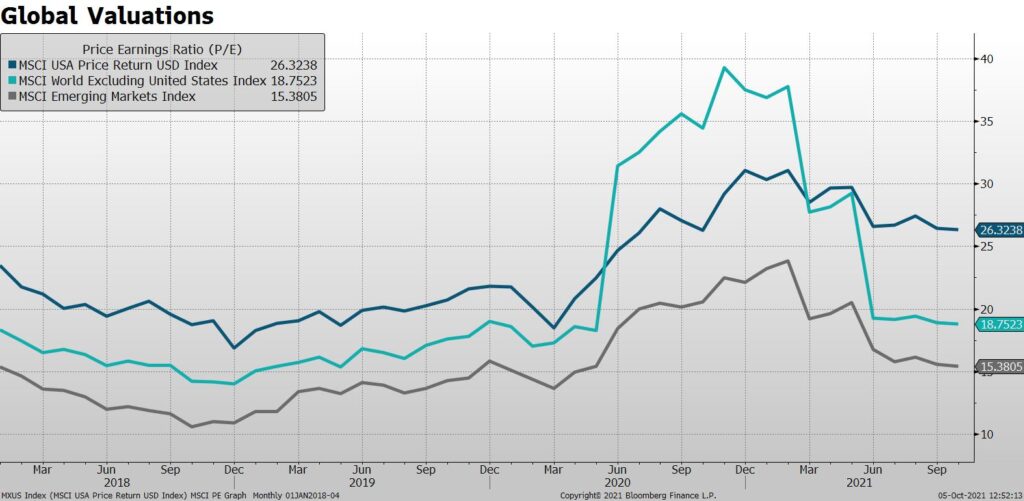
Using similar metrics, an argument could also be made that non-US stocks are more fairly priced than US stocks, and that Emerging Market stocks may be inexpensive relative to both!
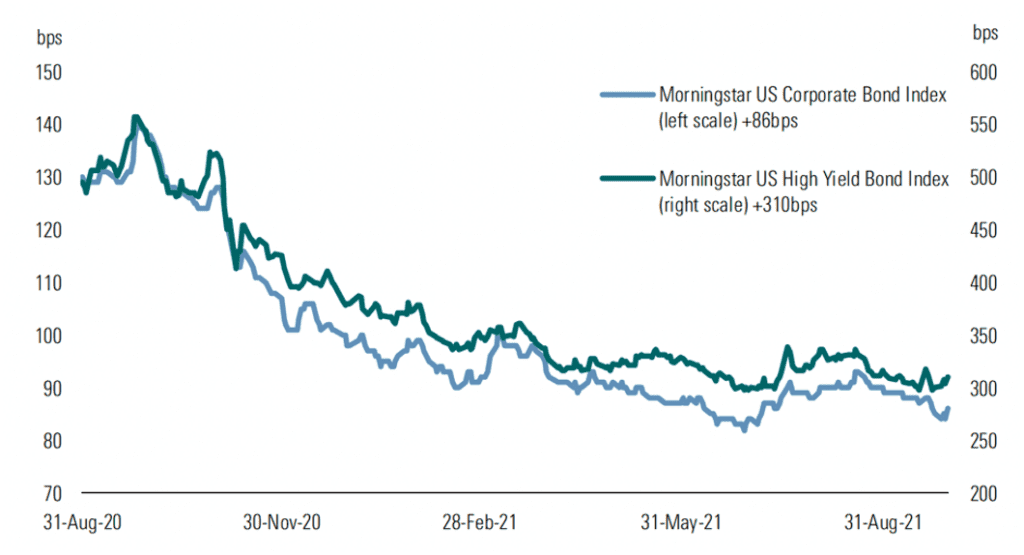
Tight Spreads Continue
Finally, in the bond markets, yields seem to be showing signs of a bottoming, with 2 and 10 year treasury notes up off their pandemic lows. It has been challenging to find ways of improving yield, particularly given the fact that credit spreads, or the amount of excess return investors receive for taking on credit risk, have been narrow and haven’t shown signs of widening over the recent year.
DISCLAIMER: The foregoing content reflects the opinions of Penobscot Financial Advisors and is subject to change at any time without notice. Content provided herein is for informational purposes only and should not be used or construed as investment advice or a recommendation regarding the purchase or sale of any security. There is no guarantee that the statements, opinions or forecasts provided herein will prove to be correct.
Transcription
Sam Chaplin: Hi everybody. Welcome to another PFA Investment Update. My name is Sam Chaplin. I am joined by James Bradley.
James Bradley: Hi everybody.
Sam Chaplin: Another round here of an economic review, market review and some stuff we’ll be watching looking forward. We’re going to jump right into something you might be seeing a lot of, this chart’s going to show you how the word stagflation has showed up in the headlines and in articles in Bloomberg a enormous amount lately. We want to make sure you understand what stagflation is and whether it’s a real threat or whether it’s just some bait, hoping to get you to click on some articles and read them. Stagflation is a bit of a economic boogeyman because it’s a bad scenario where it’s a period of high inflation as well as low growth. It’s also marked by high unemployment generally.
That puts us into a tricky situation where the tools the Federal Reserve would use under high inflation, would raise the rates, which would incentivize people to save their money rather than spend it, which cools the economy a bit. Problem with that is if you have high unemployment and you’re raising rates, then it also makes it harder for businesses to hire people. Their cost of capital is higher, they have less free cash flow, so you’d end up having high inflation and low growth, which is a real bad situation. We’re going to first take a look at the growth outlook, both with consumers and businesses, and then we’ll look at the inflation trends and how we’re moving along there. Jim can start us off looking at the S word with the consumer outlook.
James Bradley: Thanks, Sam. Stagflation, I’m old enough to remember when stagflation was a thing and it happened kind of back in the ’70s and was typified by high levels of unemployment and also high levels of inflation at the same time before that. I guess people didn’t think that could really happen, but lo and behold it can in certain situations. Are we there now with stagflation? Let’s take a look at the stag part of it, is the economy stagnating? And there’s indications that kind of lead people to either side of that argument. If we look at, for example, consumer confidence, we can see that the most recent number is a little bit lower. There’s been a little bit of a down trend over the past couple of releases, but the index bottomed out at about an 87 in December, in January, and that seems to be a little bit of a crater there, but when we compare it with what we saw on the financial crisis, it was down to 25 at the time.
I think all in all we’re off of highs, but consumer confidence is still relatively well there. And on the right hand side, we can see that Chase card spending has basically returned to its trend level. It’s currently 9.9% above pre pandemic levels from two years ago. And retail sales numbers continue to beat expectations. Again, not necessarily indicative to anybody who’s looking at it at an arm’s length that we’re looking at real stagnation. That’s the consumer side. If we look on the corporate side, one of the things that people are pointing toward, as with some degree of concern, is that earnings boosts the relative amount of revisions to the upside that companies are making has been coming down as well over the past few months. But it’s important to point out that there’s still earnings revisions upward that we’re looking at, pretty significantly different than what we saw during a big part of the period from 2018, mid 2018 to mid 2020 where we saw a trend more toward earnings revisions downwards.
Sure, a little bit of a slowing there, but again, the revisions are still on the upward side. There’s a lot of concern about, for this quarter that we’re in right now, the fourth quarter, are we going to be able to beat some of those higher revised upward earnings numbers? And well, so far we’re about in the meat of earnings season right now, but the answer seems to be so fa yeah. Current estimates show that we’ve got elevated GDP growth continuing pretty much through 2022. One of the things that we’ve seen lately is a little bit of a downward revision to what some people thought were going to be the GDP numbers for the next couple years, but they’re small downward revisions and they’re coming off of really relatively high numbers.
And the trend still seems to be that we come back down to more normalized numbers, but normalized numbers that are at least as high as what we’ve been seeing over pretty much the past decade or more. Again, not really convincing us that stagnation is really happening. And we’re going to get our first look at the third quarter GDP a couple days after we record this. We’re looking at a number that for the quarter we think is going to be relatively robust, upwards of around 2.8%.
Sam Chaplin: Yeah, interesting to see the categories here on the what contributes to the GDP as well, whether it’s more workers in the workforce or them being more productive or just higher population in general. That wraps up the growth side of things. I’ll give you a little rundown on the inflation side, and I’m sure everybody’s seen some inflation as they go to the grocery stores and are shopping around. In the headlines you might see a lot about CPI and the PCE, CPI being the Consumer Price Index and the PCE being the Personal Consumption Expenditures Price Index. You might be wondering why are there two of these? Is it just to make things more confusing? But both track a basket of goods and how their prices change over time, but there are differences in how those baskets are constructed.
CPI is based on surveys of what consumers are buying, where the PCE is based on surveys of what businesses are selling. Additionally, CPI does not count expenditures that are not out of pocket. If your employer pays part of your healthcare, that’s not counted in the CPI, where it is in the PCE. And I think one of the biggest defining factors too is the PCE is a little more dynamic in that it allows for substitutions. Maybe bread was in the index at first, but then it got too expensive, people stopped buying it, they start buying something like rice and the PCE will reflect that change. And for that reason it tends to be a little lower than the CPI. The PCE is the preferred index used by The Federal Reserve. They target about 2% increases per year in the PCE index. They’ve been well below that for long before the pandemic, but well above those levels now.
James Bradley: You just created the vision in my mind about somebody trying to make a peanut butter jelly sandwich with rice.
Sam Chaplin: Yeah, yeah. I don’t know, maybe not the best example, but maybe a bacon hotdog, something like that.
James Bradley: There you go.
Sam Chaplin: We can see the prices are on the rise still, but at a slower pace. It’s starting to round off at the top there. When we look at it in context though, one of the big problems is when you look at year over year price changes, we’re comparing the prices right now to the prices a year ago and a year ago, as you can probably can all remember, we’re near lockdowns, people weren’t out spending a lot of money. Demand was low, which means prices were artificially low. That’s what’s called the baseline effect in that it’s not really fair to compare prices now to the baseline of a year ago. Because those prices were a bit out of whack with where they would be in normal times.
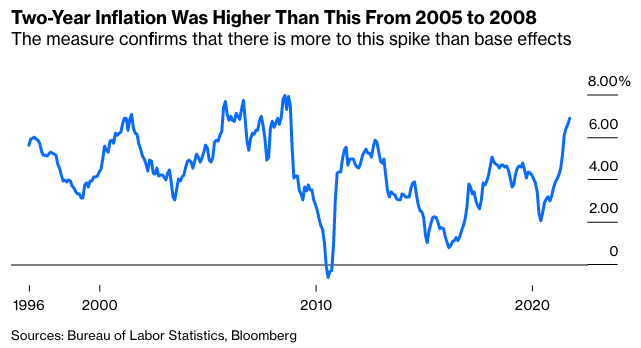
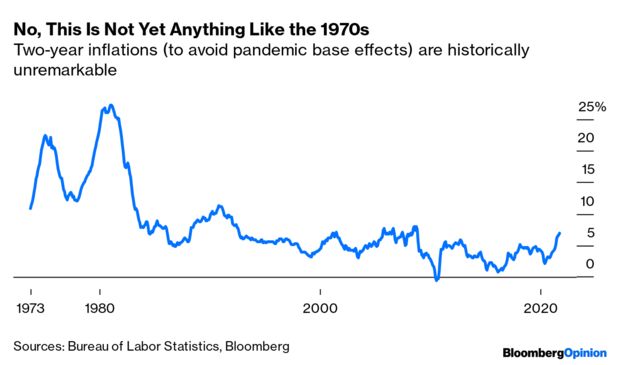
This chart looks at prices today versus two years ago to eliminate that baseline effect. You might see a lot of other scary headlines talking about inflation being like it was in the 1970s, but you can see here that the two year price changes are not nearly at the levels that they were near the ’70s. And on the next slide, we’ll see they’re not even at the levels they were from 2005 to 2008. We’re not in unprecedented times right now as far as inflation by any chance. Unprecedented times for many other reasons. But inflation is still within a range that we’ve seen in recent history. It just depends where it goes from here.
James Bradley: Given all this data that we’ve just gone through, Sam, I want you to tell us, is stagflation going to happen?
Sam Chaplin: Oh, wow. Really going to put me on the spot. Some of the most polarized conversations you’ll see out there right now, I mean, everything’s a little bit polarized right now, but if you go online, you’re going to see some people saying we’re going into hyperinflation. It’s already happening. And you’re going to some see some people saying The Fed’s going to hike too soon and we’re going to have deflation. I think with anything, the truth is somewhere in the middle. Can’t take a whole position on that. All we can do is watch the data and not let the emotions take hold and let them polarizes us even more.
James Bradley: I think you’re right. There’s plenty of people on both sides of the argument right now, but it certainly does get a lot of attention. We’ll pay attention to it too.
Sam Chaplin: Team transitory versus team structural [inaudible]-
James Bradley: That’s right.
Sam Chaplin: … on Twitter. It’s everybody’s got to be on a team now and everything’s either a crisis or a great something, great reset, great recession, everything. That wraps up the conversation about economic growth. Can move on to the market review where Jim’s going to start off talking a little bit about equity valuations.
James Bradley: Sure, and for those of us who watch these quarterly commentary pieces routinely, you’ll get used to the fact that we really focus a lot on valuations. And valuations aren’t just necessarily a raw number, but how prices of stocks or any type of investment relate to the amount of earnings that you get from those. And the higher that valuation, arguably the scarier we get because it’s basically getting us a lower yield on the investments that we’re making. If we look at the S&P 500 index, it’s a little bit of a busy graph, but the S&P 500 index is the blue line here, the price to earnings ratio for it, we can see that’s crept up. It was pretty high in late 2020. It’s come down a little bit, but still at 21 and a half roughly times earnings, that’s a little bit higher than it’s been historically.
It equates to somewhere around a 4-5% earnings yield on those larger cap stocks. But if you look historically where that line has been, it’s typically been below the other two lines, the teal line and the black line for a good long period of time. But now it sits above those lines. In other words, valuations on large-cap stocks are higher than valuations on small and mid-cap stocks. Not always the case typically, and something that really catches our attention. And in times like this, when we look at those small and mid-cap stocks, arguably trading at valuations lower than they’ve historically been, it certainly gets our attention. It’s not going to mean that there’s going to be outperformance in small and mids right away off the bat, but it certainly gives us a little bit of a tailwind in that area. And we go to the next slide and look at where the overall market is valued.
This is Morningstar’s assessment of is the market expensive relative to fair value or is it cheap? Well, we can look at the fact that back in June in that upper left-hand corner of that grid, it was showing that the market by their estimation, was about 4% overvalued relative to fair value. And we kind of followed that arrow up to more recently the September numbers, the same exact number. Morningstar was thinking that the market was still a little bit overvalued. Market kind of crept back a little bit since then and to today it’s back up to where it was. Arguably if they ran the numbers today, they might say the same thing. But what’s really changed in that short period of time is that part of the market, the growth part of the market, this is the perhaps to name companies, Amazon and Google, and Tesla.
Those are arguably more overvalued than they were back in June. Whereas the value side of the equation, the old fashioned Johnson & Johnsons of the world are, Procter & Gambles of the world are arguably priced more cheaply than they should be right now relative to where they were. More value has been created on the value side and more kind of overpricing, at least from Morningstar’s standpoint on the growth side. And so people looking to deploy assets now might find more of a tailwind on the value side. It doesn’t necessarily translate into immediate returns up or down, but it’s something interesting to take away from it. If I were to hand it over to you, Sam, I’d be looking at a little bit of validation of what we’re looking at there from a standpoint of growth being more expensive and value being more cheap. I think you got it for us.
Sam Chaplin: Yep. That’s exactly what this chart is confirming here. Kind of the same theme of value being above where its trend levels were before the pandemic as far as valuations, where value is much closer to being back in line. There are also some reasons that value does tend to perform well coming out of recessions, includes a lot of financials and energy companies which do well in those time periods. They’ve certainly been doing well lately, but according to this chart, there might still be some room to run on that side in that category of equities. Another way we can segment out the market is by looking at global valuations. We tend to hone in as most US investors do on the domestic side of things, but it’s important to look at the rest of the world’s valuations and seeing how we compare. Similar, this is on a trailing basis P/E here, US in the blue line is at the highest valuations by far.
And you can see that spread between US and international developed in the teal line is about as wide as it’s been in quite some time before the pandemic. Meaning that either US stocks are expensive or international are cheap. There are certainly some reasons based on US monetary policy and everything we’ve done here stimulus wise that put a lot of money into the system that US stocks might be more expensive. You can also take a look at the gray line there, which is the emerging markets of the world, which are even cheaper than the internationals developed and the US stocks. It’s generally, as you can see, the trend is for that to be the range. It goes US, then international, then emerging markets. But what’s interesting here is the spreads between the US stocks’ valuations and the internationals. Something to keep in mind there.
James Bradley: Switching over to the bond market. Some people say that’s the smart money is on the bond market side, while the irrational kind of crowd mentality is on the stock side. Who knows whether that’s really the case, but if it is the case and we look at relative movements of investment grade debt versus riskier credit, high yield stuff over the past year, they’ve traded in roughly the same pattern. And so bottom line is it’s still really kind of hard to find yield in the bond market. And arguably a lot of the safe stuff is yielding negative numbers on a real basis when you adjust for inflation. But the relationship between the two has kind of stayed steady and that’s potentially an indication that the market sees credit risk as not growing. And that’s usually we do see credit risk growing in those spreads widening. That’s the bond market looking at rocky economic times ahead. Just doesn’t seem that the bond market is seeing that the way it’s priced right now.
Sam Chaplin: Yeah, that seems to be the case. It’s difficult allocating assets right now with interest rates as low as they are. Some people saying the 60/40 is not working as well right now as it has in the past. And you have to look for alternatives, which is something we’ve been doing for quite some time, but certainly be watching credit risk and interest rate risk on the fixed income side as opportunities present themselves. One of the biggest unknowns right now looking forward is labor market recovery. Currently the percentage of eligible Americans participating in the labor force stands at 61.6%, which as you can see in this chart is pretty low relative to recent history. Haven’t seen levels that low since 1976. Seems to be a big reset going on with people considering their work-life balance and what the value of work is for the first time in a long time.
Appears labor kind of has the upper hand here, at least the suppliers of labor versus consumers of labor, and they’re definitely exercising that right. You’ve seen salaries and wages come up in reaction to that, trying to attract people back to work. A lot of people have thought once the federal unemployment benefits expire, that we’d see a big rush back to work and we haven’t really seen that yet. We’ve seen high amounts of people quitting jobs. Also very polarized expectations on people’s thoughts on why that is. But at least for the moment, people are using this pandemic to fight for better wages and working conditions. How that moves forward will be very important. As we saw in the GDP graph earlier on, population growth and worker growth can be a big portion of GDP. Right now the US is pretty slow population growth going forward. If people start falling out of the labor market at faster than expected rates, then that could be a big problem. Especially women unfortunately have been falling out of the labor force at higher rates. That’s the labor market looking forward.
Another thing we’re watching is rate hikes. Federal Reserve can raise rates to fend off inflation. This chart shows how people’s expectations of rate hikes have changed throughout the year where they thought rates would be at any certain part. You can place bets on that in the market. That’s how they drive these numbers. But anticipation is that can be almost four rate hikes by the end of next year. It’s a lot faster than we initially expected, generally in reaction to higher than expected inflation numbers. The tricky part here is that the risk of not raising rates fast enough is inflation, right? Raising rates cools the economy, incentivizes people to save over spend, slows down that velocity of money and will generally quell inflation.
However, the kind of dangerous side is if you wait or if you hike rates too soon, you’ll be squashing that demand at the same time that all these supply chains are coming back online. And we could end up with the exact opposite problem we have right now, which would be too much supply and not enough demand, which could actually create deflation, which is counterintuitively actually more dangerous than inflation itself. It’s a bit of a balancing act going on with The Federal Reserve right now of timing, when to raise rates. Certainly going to be something we watch going forward. And Jim will talk a little bit more about those supply chain disruptions.
James Bradley: Yeah, this is a picture that’s probably familiar to a lot of people. We’re seeing a lot of backups at ports around the world. It’s led to long wait times and higher prices for imported goods. A lot of times you’ll hear the kind of glib phrase that the cure for high prices is high prices. As bottlenecks kind of drive prices up and that can have the impact of curtailing demand, demand being curtailed actually brings down the prices again. It also allows for opportunities for more providers, more suppliers to get into the picture and try to find ways around these bottlenecks, which also is kind of its own cure in and of itself.
We’re optimistic, I’d say, and you’d probably join me, Sam, in being optimistic about the fact that the supply chain disruptions that we’re seeing right now are going to be resolved and they’re probably going to be resolved in a timeframe that’s kind of not quite as long as I think some economists are predicting, but it’s really kind of hard to tell exactly how long that’s going to be, and it’s still likely by most accounts to get worse before it’s going to get better. Sam, the one thing I’d recommend for you is that to the degree to that you’re going out doing shopping for my Christmas gift, I would like it if you’d get right on that soon because it could take a little bit longer to arrive.
Sam Chaplin: Oh yeah, great advice. Thanks for that. Great. Well, that about wraps it up, we won’t see you until next year. Hope everybody has a happy holidays and gets to see their family this year and enjoy the time.
James Bradley: Enjoy your holiday season, everybody, and we’ll see you again in 2022.
DISCLAIMER: The foregoing content reflects the opinions of Penobscot Financial Advisors and is subject to change at any time without notice. Content provided herein is for informational purposes only and should not be construed as investment advice or a recommendation regarding the purchase or sale of any security. There’s no guarantee that the statements, opinions or forecast provided herein will prove to be correct.