
Market Commentary | November 2020
James Bradley & Sam Chaplin discuss the current investment climate in the wake of the US Presidential election, Coronavirus and earnings season. You can watch the video above or read the commentary below.
Market Review
July kicked off the third quarter with a bang as stocks surged throughout much of the month. Investors were encouraged by solid employment growth, a rise in personal income and consumer spending, a surge in the housing sector, and an increase in industrial production. All news was not positive, however. The second-quarter gross domestic product fell more than 31% and many states saw an increase in the number of reported COVID-19 cases. Nevertheless, investors stayed with equities, pushing values higher for the fourth consecutive month. Tech stocks drove the Nasdaq to a 6.8% gain, followed by the S&P 500 (5.5%), the Global Dow (3.5%), the small caps of the Russell 2000 (2.7%), and the Dow (2.4%). Treasury bond prices climbed, sending yields lower in July. Crude oil prices settled at $40.40 per barrel, nearly $1.00 ahead of their June closing values. Gold prices closed July at $1,990.00, about 11% higher than June’s closing price.
The positive run for stocks continued in August, as each of the benchmark indexes listed here advanced notably. The Nasdaq climbed nearly 9.6%, the Dow rose 7.6%, the S&P 500 advanced 7.0%, the Global Dow vaulted 6.0%, and the Russell 2000 gained 5.5%. Crude oil and gas prices rose marginally, while the price of gold fell. Throughout the month, states struggled to settle on appropriate protocols for reopening schools. Testing for the virus increased, and the number of reported COVID-19 cases and deaths rose.
September saw stocks fall on waning hopes of a second round of stimulus. Also, discord between the United States and China ramped up following President Trump’s threatened recourse against American companies that create jobs overseas or that do business with China. Technology shares took a sizable hit, particularly early in the month. September saw several days of favorable returns, likely due to bargain hunters. Unfortunately, there wasn’t enough buyers to prevent the benchmark indexes from falling lower by the end of each week of the month. September saw each of the indexes fall, led by the Nasdaq (-5.2%), followed by the Global Dow (-4.3%), the S&P 500 (-3.92%), the Russell 2000 (-3.45%), and the Dow (-2.28%).
Overall, the third quarter of 2020 produced the second consecutive quarter of notable market gains. The tech-heavy Nasdaq again proved the strongest, climbing more than 11.0% for the quarter, followed by the large caps of the S&P 500 and the Dow, which gained 8.5% and 7.6%, respectively. The Global Dow advanced 5.0% for the quarter, and the small caps of the Russell 2000 ended the quarter up 4.6%.
Year to date, the Nasdaq remains well ahead of its 2019 year-end closing value, while the S&P 500 is more than 4.0% over last year’s closing mark. The remaining benchmarks continue to gain ground, with the closest to its year-end value being the Dow, followed by the Global Dow and the Russell 2000.
By the close of trading on September 30, the price of crude oil (CL=F) closed at $39.64 per barrel, below the August 31 price of $42.81 per barrel
Economic Review
Employment: Employment increased by 1.4 million in August after adding 1.8 million jobs in July. These improvements in the labor market reflected the continued resumption of economic activity that had been curtailed due to the COVID-19 pandemic and efforts to contain it. Nevertheless, the number of job gains in August is 7.6% below the pre-pandemic level of February, which saw 11.5 million new jobs added. In August, notable job gains occurred in leisure and hospitality, government, retail trade, professional and business services, and education and health services. The unemployment rate dropped 1.8 percentage points to 8.4% for August as the number of unemployed persons dropped by 2.8 million to 13.6 million. These measures remain well above their pre-pandemic February figures of 4.9% and 7.8 million, respectively. The insured unemployment rate was 8.1% (9.9% as of August 15). The highest insured unemployment rates in the week ended September 12 compared to their respective rates on August 8 were in Hawaii (21.3% vs 19.8%), California (16.1%, unchanged), Nevada (14.7% vs 17.3%), New York (13.7% vs 15.4%), Puerto Rico (12.8% vs 19.2%), Louisiana (12.6% vs 13.5%), Georgia (12.2% vs 12.6%), and the Virgin Islands (11.9% vs 12.8%). During the week ended September 12, 50 states reported 11.8 million individuals claiming Pandemic Unemployment Assistance benefits and 50 states reported 1.8 million individuals claiming Pandemic Emergency Unemployment Compensation benefits.
FOMC/interest rates: The Federal Open Market Committee held its regularly scheduled meeting in early June and unanimously voted to hold the target range for the federal funds rate at 0.00%-0.25%. According to the Committee, the ongoing public health crisis caused by the COVID-19 pandemic will weigh heavily on economic activity, employment, and inflation in the near term, while posing considerable risks to the economic outlook over the medium term. The FOMC expects to maintain this rate until it is confident the economy has weathered the recent events, which according to its projections, will run through the year 2022. In addition, the Fed announced that it will be increasing, at least at the current pace, holdings of Treasuries and residential and commercial mortgage-backed securities.
GDP/budget: According to the third and final estimate for second-quarter gross domestic product, the economy decelerated at an annualized rate of 31.4%. GDP decreased 5.0% in the first quarter on the heels of the spring lockdown. Consumer spending was a big drag, falling 33.2%, reeling from the initial effects of the pandemic. Fixed investment fell 29.2% in the second quarter (-1.4% in the first quarter), and nonresidential fixed investment dropped 27.2% in the second quarter, compared to a 6.7% decline in the prior quarter. Exports were down 64.4%, and imports sank 51.1%. Nondefense government expenditures increased 37.6% due to stimulus spending programs initiated in response to the pandemic. The monthly Treasury budget deficit for August was $200 billion, essentially equal to the August 2019 monthly deficit. Through 11 months of the fiscal year, the government deficit sits at $3.007 trillion, a 182% increase over the same period from the previous fiscal year. Government outlays for the current fiscal year are 46% greater than expenditures for fiscal year 2019.
Inflation/consumer spending: According to the Personal Income and Outlays report for August, personal income decreased 2.7% and disposable (after-tax) personal income dropped 3.2% after advancing 0.4% and 0.2%, respectively, in July. Consumer spending increased in August, climbing 1.0% for the month, well short of July’s 6.2% advance. Inflation remained somewhat muted as consumer prices inched ahead by 0.3% in August after increasing 0.4% in July. Consumer prices have increased by a mere 1.4% over the last 12 months, well below the FOMC target.
Inflation/consumer spending: Consumers ramped up their spending in May, as personal consumption expenditures increased 8.2%, after falling 12.6% in April. Inflation remains muted as prices for consumer goods and services rose a scant 0.1% in May after falling 0.5% the previous month. For the past 12 months, consumer prices are up a mere 0.5%. The Consumer Price Index slid 0.1% in May, marking the third consecutive monthly decrease, which hasn’t happened in the 63-year history of this index.
Housing: After a rough 2nd quarter, the housing market picked up markedly in the 3rd quarter. In August, sales of existing homes jumped 2.4% last month after climbing 24.7% in July. Over the 12 months ended in August, existing home sales are up 10.5%. The median existing single-family home price was $315,000 in August, up from $307,800 in July. Supply of residential real estate tightened, with August’s inventory of new single-family homes for sale representing a supply of 3.3 months at the current sales pace, down from July’s estimate of 4.0 months.
International markets: Europe saw an increase in COVID-19 cases reported, likely impacting stocks. STOXX Europe 600 index lost value by the end of September, Germany’s DAX Performance index fell, while the UK’s FTSE 100 was flat. France, Spain, and the United Kingdom took steps to stem the latest wave of virus cases. Stocks in China fell as the Shanghai Composite index and CSI 300 lost value. On the economic front, Japan’s purchasing managers index remains in contraction territory as calls increase for new stimulus from the Bank of Japan.
Consumer confidence: The Conference Board Consumer Confidence Index® increased in September after declining in August. The index stands at 101.8, up from 86.3 in August. The Present Situation Index, based on consumers’ assessment of current business and labor market conditions, increased from 85.8 to 98.5. The Expectations Index, which is based on consumers’ short-term outlook for income, business, and labor market conditions, increased from 86.6 in August to 104.0 in September.
Looking Forward
 Major drivers of performance in the 4th quarter will undoubtedly include the US Presidential Election, a likely increase in COVID-19 cases (and progress toward a number of vaccines), and progress (or lack thereof) on another round of fiscal stimulus from congress.
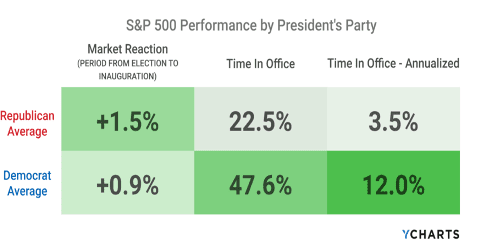
As of the publishing date, odds are increasingly supportive of the idea that not only will Joe Biden take the White House, but that he will have a Democratic majority in congress. A number of market indicators are indicating increasing expectation that this will be the outcome. On average, markets tend to increase during the period immediately following a presidential election, regardless of the party who wins the White House.
However, there is some likelihood that a period of time may go by when we don’t have a clear victor in this election. The only obvious precedent for such an outcome is the presidential election of 2000. Between election day on November 7 and the Supreme Court ruling that delivered the presidency to George W. Bush, the S&P 500 index was down 4.24%
 Widely held expectations are for a continued slow, upward trend for the US economy in October. The market took a hit in September but showed signs of recovering toward the end of the month. This year, however, stocks are not moving in complete unison.
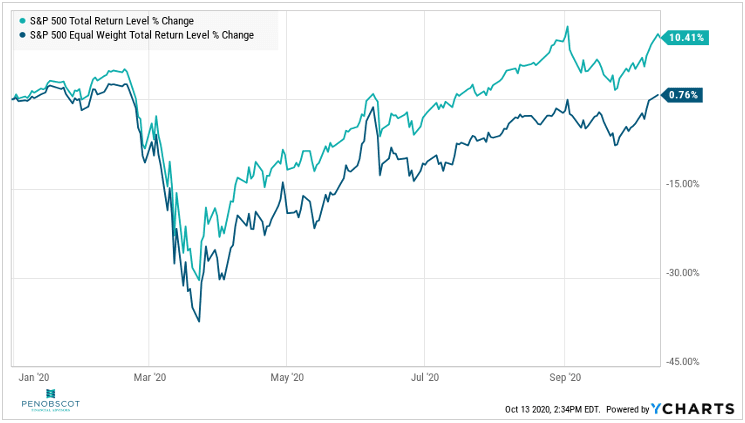
Shares in massive technology companies have made great strides this year. Since the S&P 500 is a market-cap weighted index, it has risen far more substantially than the average stock making up the index.
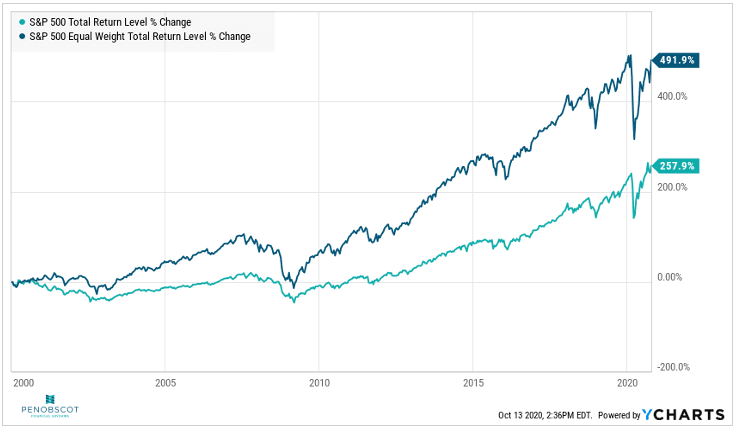 The phenomenon of a small number of mega-cap companies significantly beating the remainder of the market has not been the norm, though. The chart below suggests that over the past 20 years, S&P 500 companies with smaller market capitalizations have performed better than their larger counterparts, evidenced by significant outperformance by the S&P Equal-Weight index relative to the more traditional S&P Market-cap weighted index.
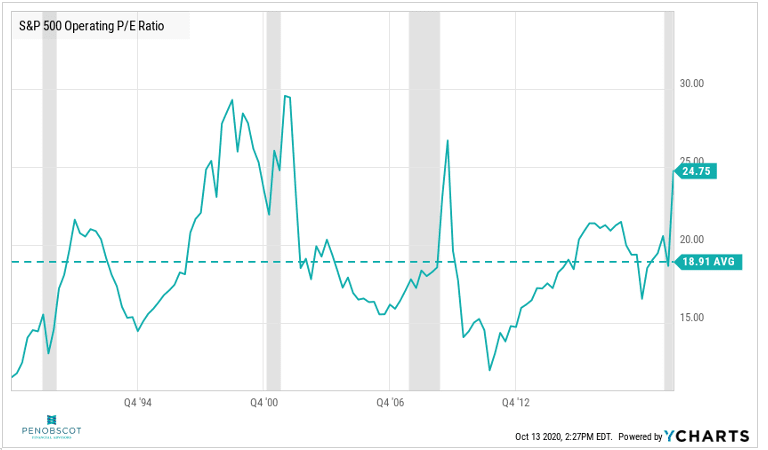
The progress in the market recovery has left operating price-to-earnings ratios on the S&P 500 a bit higher than average. While this warrants attention, the potential for earnings to increase in a recovery tends to drive these ratios higher in periods of recovery from recessions.
PFA places focus on environmental, social and governance standards as key elements in considering portfolio elements. Corporations who exhibit leadership in these standards have proven that they may be better stewards of shareholder money over the longer term.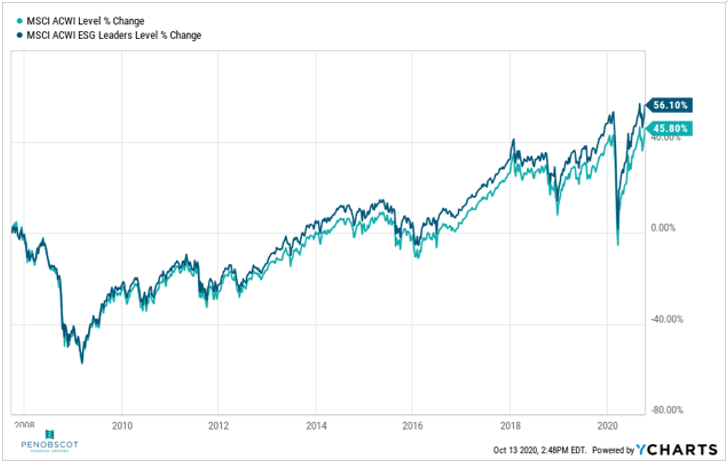 US stocks have experienced a more substantial comeback than international stocks, both developed and emerging.
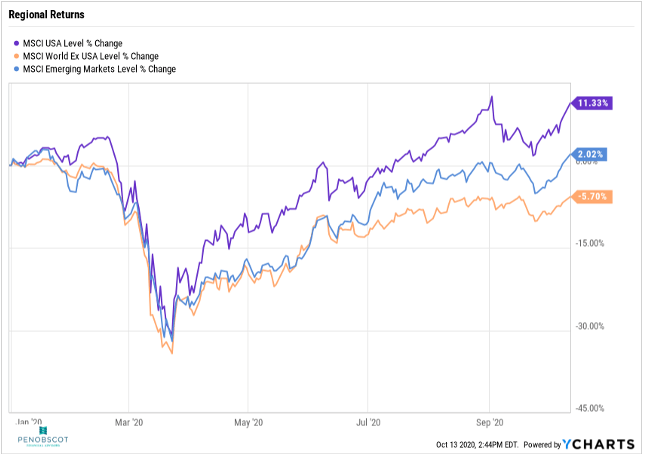 Looking forward, however there are a number of very good reasons to continue to diversify into international developed and emerging markets. A combination of higher potential growth, lower price multiples, and higher dividends overseas make the inclusion of non-US equities desirable. This is especially so combined with forces that could cause the dollar to weaken. Those forces include a rising US Trade deficit and a growing US Fiscal deficit. Lastly, overall volatility has been shown to be diminished with some amount of Non-US equity allocation in a portfolio
The foregoing content reflects the opinions of Penobscot Financial Advisors and is subject to change at any time without notice. Content provided herein is for informational purposes only and should not be used or construed as investment advice or a recommendation regarding the purchase or sale of any security. There is no guarantee that the statements, opinions or forecasts provided herein will prove to be correct.