2020 Q2 Market Commentary
A video recording of Jim and Sam discussing the Q2 Commentary can be viewed HERE.
 Market Review
Stocks rebounded from a dismal March by posting their best monthly returns since 1987, as investors were encouraged by the expectation of additional government stimulus programs and hope that the economy would be reopening soon. The Paycheck Protection Program and Health Care Enhancement Act replenished the Paycheck Protection Program, providing funding for additional small business loans, and offered financial support to hospitals, while increasing the availability of more virus testing. The Federal Reserve added trillions of dollars in funds to its lending programs. Crude oil prices rose nearly 30.0% despite collapsing into negative territory on April 20. A few states began easing lockdown restrictions and reopening a range of businesses. While there were plenty of ups and downs in the market during the month, April closed with each of the benchmark indexes listed here climbing notably higher. The Nasdaq gained 15.45%, followed by the Russell 2000, the S&P 500, the Dow, and the Global Dow.
In May, investors continued to rally to stocks as more states and foreign countries eased restrictions put in place in response to the COVID-19 pandemic. The economy continued to stagger, however. The unemployment rate reached its highest level since the Great Depression while claims for unemployment insurance pushed past 25 million. On the other hand, news of possible breakthroughs in the treatment of COVID-19 cases and the development of a vaccine for the virus provided optimism for investors. Once again, the Nasdaq led the way, advancing 6.75% by the close of May. The Russell 2000 gained 6.36%, followed by the S&P 500, the Dow, and the Global Dow.
June was a month of drastic highs and lows for stocks. For example, the Dow climbed 6.8% in the first week of the month, then fell 5.5% in the second week. However, by the close of June, each of the indexes listed here posted gains with the tech holdings of the Nasdaq leading the way, up nearly 6.0% from its May closing value.
The second quarter of 2020 notched the best quarterly performance since 1998, with each of the benchmark indexes making sizeable gains over their historically poor first-quarter tallies. However, much of the second-quarter growth in the stock market and economy is more of a bounce back from a dismal March and April, when pandemic-related lockdowns and restrictions virtually shut down the economy. Nevertheless, stocks rose as investors focused on favorable economic data and the possibility of further government stimulus, despite rising virus cases and tepid trade relations with China. Of major benchmarks, the Nasdaq again proved the strongest, soaring more than 30.0% for the quarter, followed by the small caps of the Russell 2000, which gained 25.0%. The large caps of the S&P 500 and the Dow closed the second quarter up nearly 20.0% while the Global Dow vaulted ahead by more than 14.0%. Year to date, the Nasdaq remains the only index well ahead of its 2019 year-end closing value. While still in the red, the S&P 500 is within 5.0 percentage points of last year’s final mark, followed by the Dow, the Global Dow, and the Russell 2000.
By the close of trading on June 30, the price of crude oil (WTI) continued to climb, closing at $39.35 per barrel, ahead of the May 29 price of $35.34 per barrel. The national average retail regular gasoline price was $2.129 per gallon on June 22, up from the May 25 selling price of $1.960 but $0.525 less than a year ago. The price of gold finished June at $1,798.80 per ounce, slightly higher than its May 29 closing value of $1,745.80 per ounce.
ECONOMIC REVIEW
Employment: Employment rose by an impressive 2.5 million in May (after falling a stunning 20.6 million in April). Notable job gains occurred in leisure and hospitality, construction, education and health services, and retail trade. The unemployment rate dropped 1.4 percentage points to 13.3% for the month as the number of unemployed persons dropped by close to 2.1 million to 21.0 million. Improvements in the labor market reflected a limited resumption of economic activity that had been curtailed in March and April due to the COVID-19 pandemic and efforts to contain it. While these numbers are better, put in perspective, the unemployment rate and number of unemployed persons are up 9.8 percentage points and 15.2 million, respectively, since February. In May, average hourly earnings fell by $0.29 to $29.75, primarily due to job gains among lower-paid workers. Average hourly earnings increased by 6.7% over the last 12 months ended in May.
FOMC/interest rates: The Federal Open Market Committee held its regularly scheduled meeting in early June and unanimously voted to hold the target range for the federal funds rate at its current 0.00%-0.25%. According to the Committee, the ongoing public health crisis caused by the COVID-19 pandemic will weigh heavily on economic activity, employment, and inflation in the near term, while posing considerable risks to the economic outlook over the medium term. The FOMC expects to maintain this rate until it is confident the economy has weathered the recent events, which according to its projections, will run through the year 2022. In addition, the Fed announced that it will be increasing, at least at the current pace, holdings of Treasuries and residential and commercial mortgage-backed securities.
GDP/budget: According to the third and final estimate for the first-quarter gross domestic product, the economy decelerated at an annualized rate of 5.0%. Consumer spending was a big drag, falling 6.8%, reeling from the initial effects of the COVID-19 pandemic. Net exports were down 9.0%, and imports sank 15.7%. The Treasury budget deficit came in smaller than expected in May. Nevertheless, the deficit, at $398.8 billion, was nearly twice as high as the deficit for May 2019. Through the first eight months of fiscal 2020, the deficit is $1.880 trillion, nearly 91.0% greater than the deficit over the same period in fiscal 2019.
Inflation/consumer spending: Consumers ramped up their spending in May, as personal consumption expenditures increased 8.2%, after falling 12.6% in April. Inflation remains muted as prices for consumer goods and services rose a scant 0.1% in May after falling 0.5% the previous month. For the past 12 months, consumer prices are up a mere 0.5%. The Consumer Price Index slid 0.1% in May, marking the third consecutive monthly decrease, which hasn’t happened in the 63-year history of this index.
Housing: Sales of existing homes plunged in May while sales of new single-family homes soared. Existing home sales fell 9.7% in May after falling 17.8% in April. Over the last 12 months, existing home sales are down 26.6%. Sales of existing single-family homes plunged 9.4% last month and are off 24.8% from a year ago. The median existing-home price in May was $284,600 ($286,800 in April). Unsold inventory of existing homes represents a 4.8-month supply at the current sales pace, up from 4.0 months in April. Sales of new single-family homes vaulted 16.6% in May following a slight 0.8% drop in April. The median sales price of new houses sold in May was $317,900 ($303,000 in April). The average sales price was $368,800 ($352,300 in April). May’s inventory of new single-family homes for sale represents a supply of 5.6 months at the current sales pace.
International markets: Global markets rebounded in the second quarter on the heels of fiscal stimulus, easing of restrictions, and interest rates at 0% and below. By the end of March, world stocks had lost about 35.0% from their year-end highs. By the end of June, these same markets are within 10.0% of February’s record highs. A spike in new virus cases could send world markets reeling again. While inflation remains muted in the United States, prices are slowly escalating in Europe, where longer-range forecasts see inflation rising to 1.0% — close to its highest level since early March. In Asia, the Nikkei 225 is up about 2.0% for the month, the Shanghai Composite Index has gained 2.2% for the month, and the Hang Seng Index has climbed nearly 5.0%.
Consumer confidence: The Conference Board Consumer Confidence Index® was little changed in May, coming in at 86.6, slightly above April’s 85.7 reading. The Present Situation Index — based on consumers’ assessment of current business and labor market conditions — decreased from 73.0 to 71.1. However, the Expectations Index, which is based on consumers’ short-term outlook for income, business, and labor market conditions, improved from 94.3 in April to 96.9 last month.
LOOKING AHEAD
While the stock market has pushed forward, economic indicators have been slow to tick upward. As states ease restrictions and businesses reopen, the economy should begin the slow process of recovery. However, increases in the number of reported virus cases may prompt the imposition of restrictions, at least in some states, which could impact economic growth.
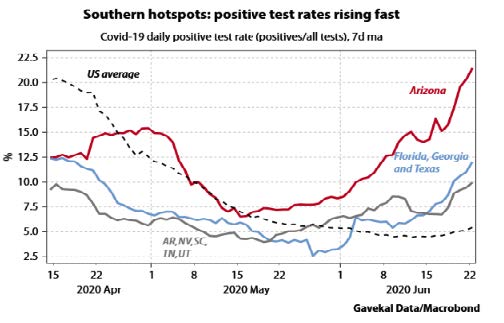
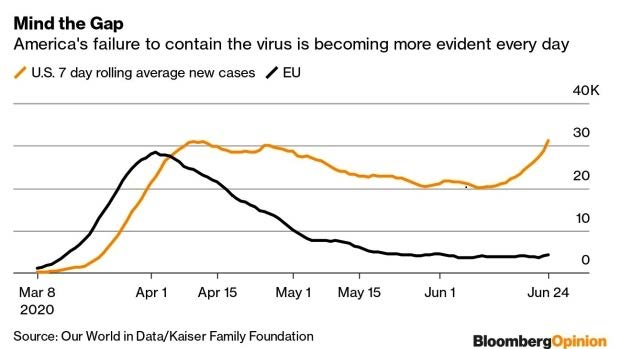 While some of the increase in new cases can be attributed to expanded testing, the percentage of positive cases has increased across the board, and markedly so in some of the ‘hotspots’
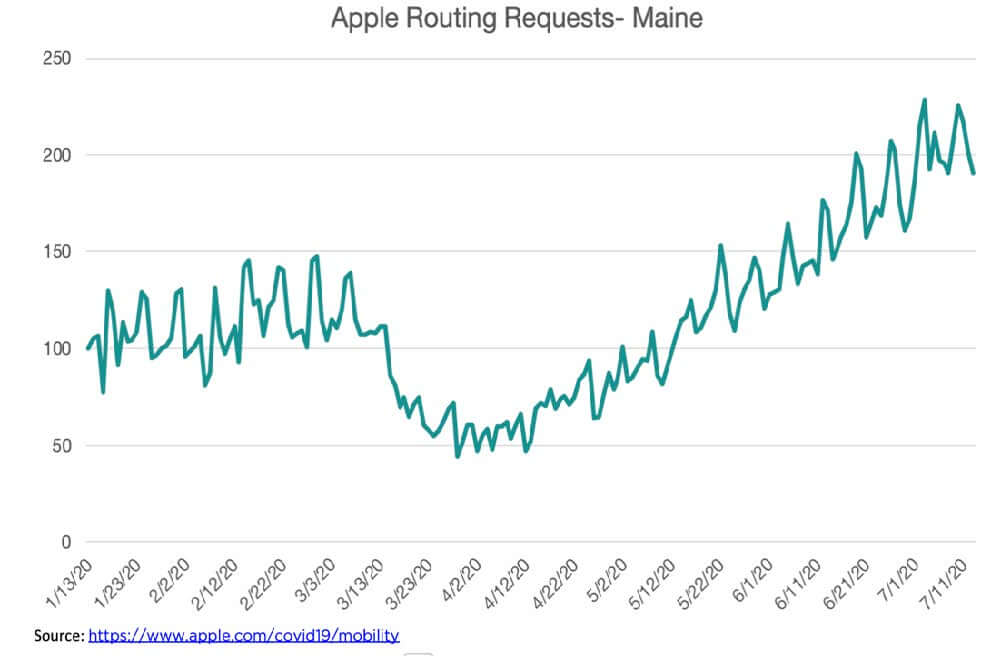
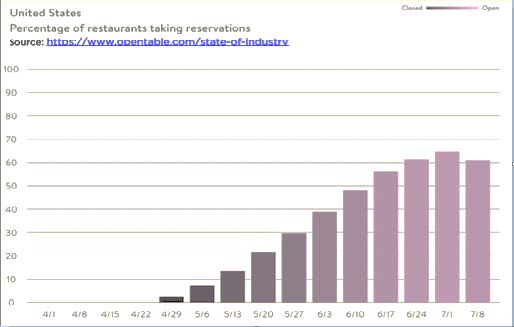
 Return to normalcy? Apple’s routing data and OpenTable’s reservation system both show a gradual emergence from the depths of the COVID-19 lockdown.
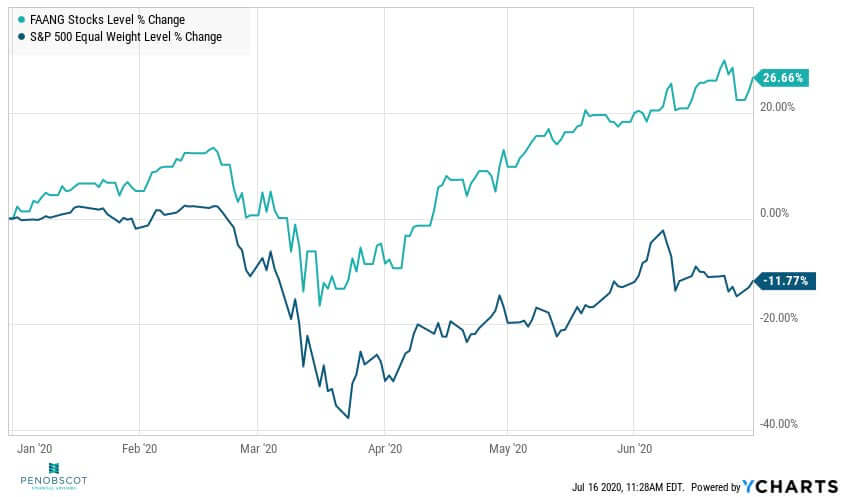
Much of the progress that has been made in the market recovery has been concentrated in the technology sector, with some of the largest tech names leading the rebound. Some concern has started to emerge that this recent run-up may be extended beyond justifiable levels.
At the same time, there are certain to be areas of the market that are out of favor currently, which may represent good opportunities as the economic recovery eventually becomes more sustainable. The share of the S&P 500 made up by its five largest companies has risen from 16.8% at the beginning of 2020 to 22.5%.
Positions in these companies have come to be seen as a safe bet because the services these companies provide are more sought-after in lockdown situations
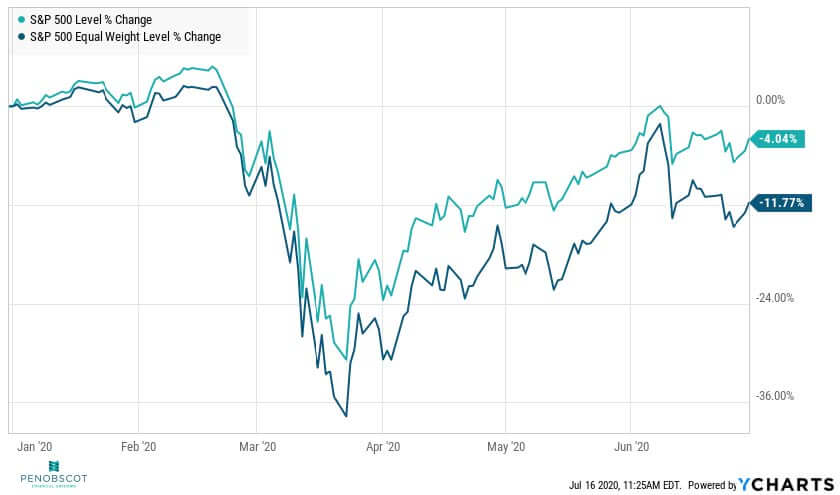
Since the S&P 500 index is weighted by market cap, the largest companies have the biggest impact on the movement of the index.
If we look at the average of all stock prices in the S&P 500 by weighting all of the companies equally, we see that the bump in performance during late May and early June has not been sustained. The average company in the S&P 500 ended the second quarter down by more than 10% on the year.
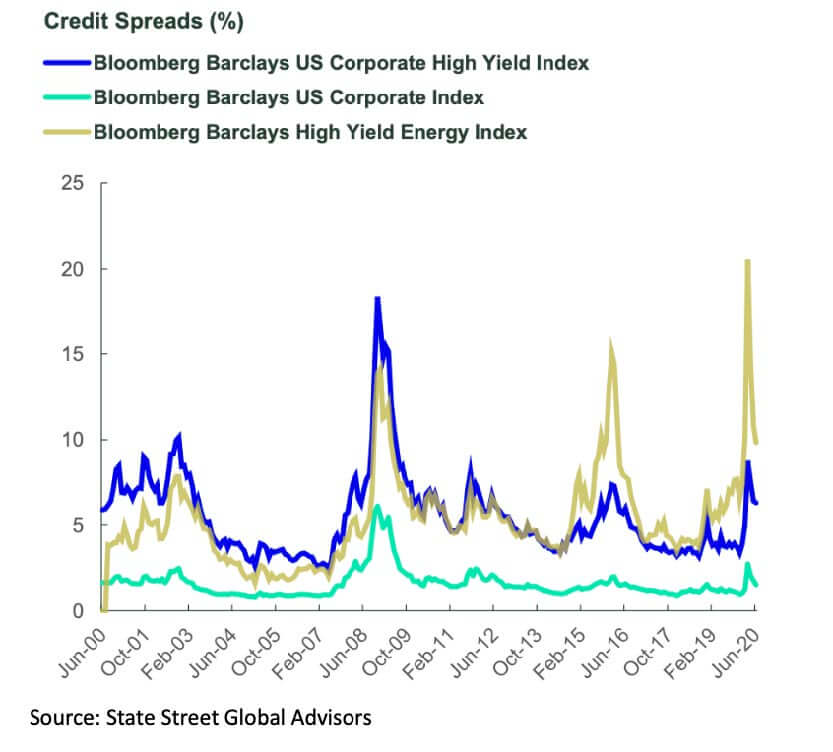
Meanwhile, in fixed income markets, credit spreads shot up (and bond prices dropped) significantly in March, even for companies with relatively high credit ratings. This panic was quelled largely by the Federal Reserve stepping in to purchase not only US Government bonds, but also corporate investment grade debt and some junk debt as well. This was unprecedented and brought spreads back down. Currently, the spread on investment-grade corporate bonds (the amount we get rewarded for taking on credit risk) is actually below its 20 year average. This is the result of investment-grade debt having recovered extremely well as a result of the “Powell Put”.
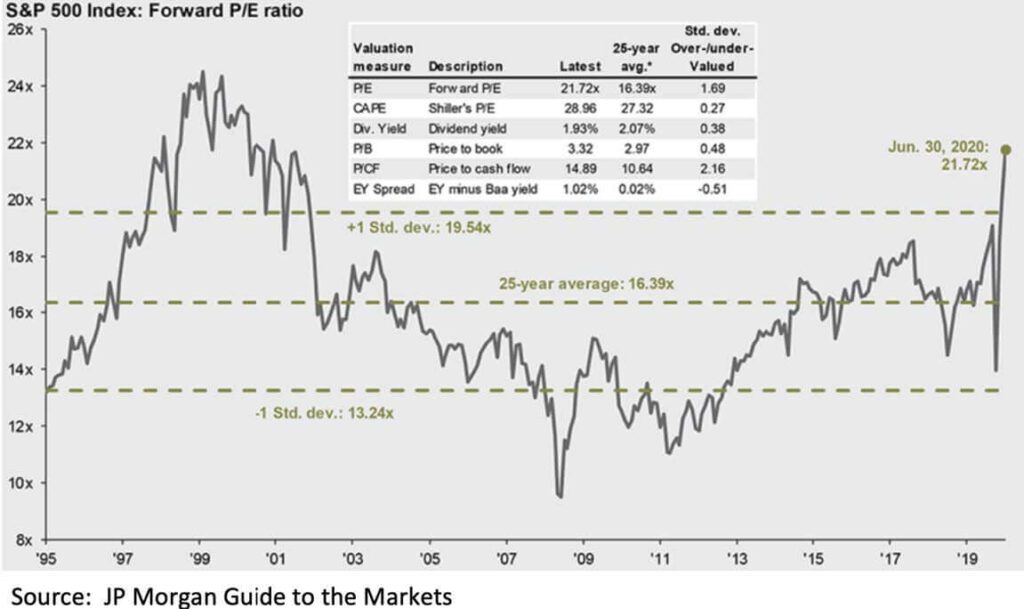
The recovery in stock prices has led to a forward Price/Earnings ratio that has not been seen since the ‘bubble’ of the early 2000’s. This is cause for some concern about markets having come too far, too fast.
A couple of points may make this less worrisome. First, any ratio with forward earnings as its denominator is bound to be subject to some wild variations at a time when the next 12 months of earnings are almost impossible to predict. Secondly, relative to the year 2000 peak, stock earnings yields even with the depressed earnings assumptions, hold a significant advantage over yields on bonds and cash. At the beginning of 2000, the 10-year treasury yield was over 6%. Currently, it is barely about 0.6%.
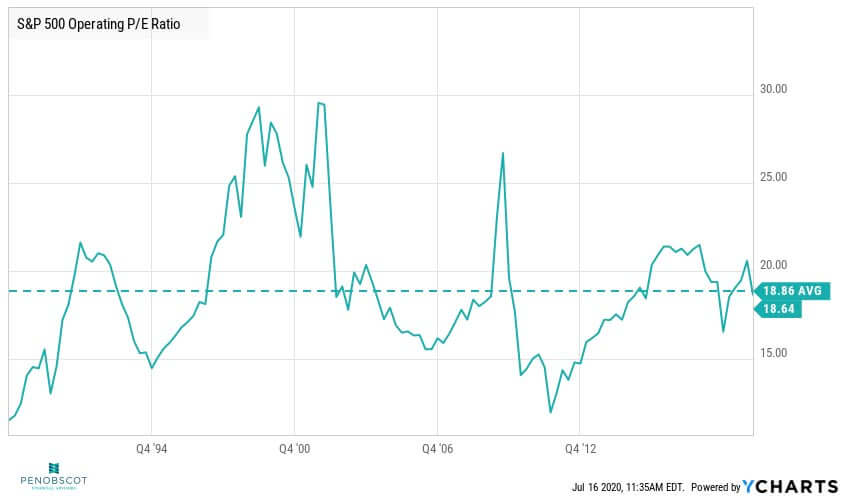
Additionally, when we consider the Operating Price to Earnings ratio, using current earnings and leaving out factors like one-time events and accounting changes, the ratio seems to be more in line with historical averages.
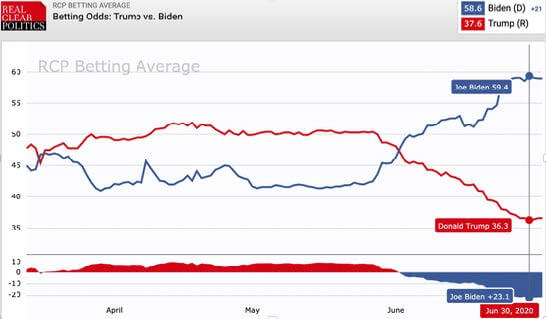
What the third quarter brings is anyone’s guess. It’s a fair bet to anticipate more volatility as uncertainty continues to reign. COVID-19 flareups, both domestically and globally, may continue to hold down economic activity and stall an already uncertain recovery. Domestically, the 3rd quarter will undoubtedly bring with it an increased focus on US politics. Markets historically have exhibited higher-than-normal periods of volatility during presidential elections where the incumbent is leaving office, regardless of party affiliation. This year has shown a sharp change in what many would regard as ‘front-runner’ status.
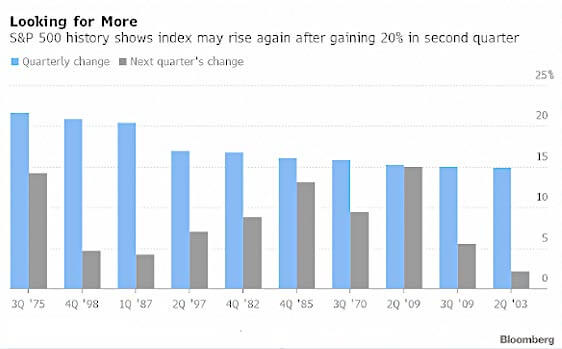
 Since markets are arguably pricing in optimistic scenarios in regard to post-pandemic recovery, we want to continue to be cautious in our approach to allocation of assets. We continue to seek out asset classes that provide low correlations to one another. In most portfolios, we have rotated from long-only commodity strategies in favor of more tactical, less correlated strategies. We’re remaining focused on our value tilt in our equity portfolios, while increasing exposure to areas that would not be as likely to be disadvantaged if a lockdown continues. There is ample historical precedent for good market quarters (and bad economic quarters) like the 2nd quarter of 2020 to be followed by continued price appreciation and we want to ensure we can take advantage of it, but we are not inclined to chase some of the high-flyers of the 2nd quarter, on overall valuation.
 The foregoing content reflects the opinions of Penobscot Financial Advisors and is subject to change at any time without notice. Content provided herein is for informational purposes only and should not be used or construed as investment advice or a recommendation regarding the purchase or sale of any security. There is no guarantee that the statements, opinions or forecasts provided herein will prove to be correct.